The e-commerce giant Amazon.com, Inc. continues to shape how consumers shop and businesses sell across the globe. From streaming services to cloud infrastructure and physical retail, Amazon’s footprint extends far beyond one click. In logistics, for instance, numerous retailers rely on its delivery model, and in cloud computing, enterprises use its infrastructure for scalable workloads. This article dives into key statistics and explores how those numbers reflect broader trends in retail, tech, and global business.
Editor’s Choice
- $167.7 billion in net sales for Q2 2025, up 13% year-on-year from Q2 2024’s $148.0 billion.
- Amazon’s market capitalisation reached $2.36 trillion as of July 2025.
- Worldwide revenue for 2024 hit $638 billion, rising approximately 11% from 2023.
- Amazon’s share of U.S. e-commerce is projected to be around 40.9% for 2025.
- Over 310 million active users globally for Amazon, with more than 230 million in the U.S. alone.
- Amazon Prime membership revenue in 2024 was about $44.4 billion.
- The “International” segment of Amazon posted $36.8 billion in net sales in Q2 2025, a 16% increase year-on-year.
Recent Developments
- In Q2 2025, Amazon’s operating income rose to $19.2 billion, up from $14.7 billion a year earlier.
- The AWS (Amazon Web Services) segment grew 17.5% year-on-year to $30.9 billion in Q2 2025.
- Amazon raised its full-year 2025 revenue guidance to approximately $700 billion, based on trend estimates.
- The platform initiated internal optimisation projects, including removing underperforming product listings to reduce catalogue bloat and infrastructure cost.
- Amazon’s cloud and AI infrastructure spending exceeded $100 billion annually, with global data-centre capex rising strongly.
- Amazon’s marketplace saw traffic surpass 2.5 billion monthly visits, with more than half of the traffic from mobile devices.
- In the U.S., Amazon accounted for about 61% of online shoppers beginning their product search on the platform.
Gender and Age Demographics Overview
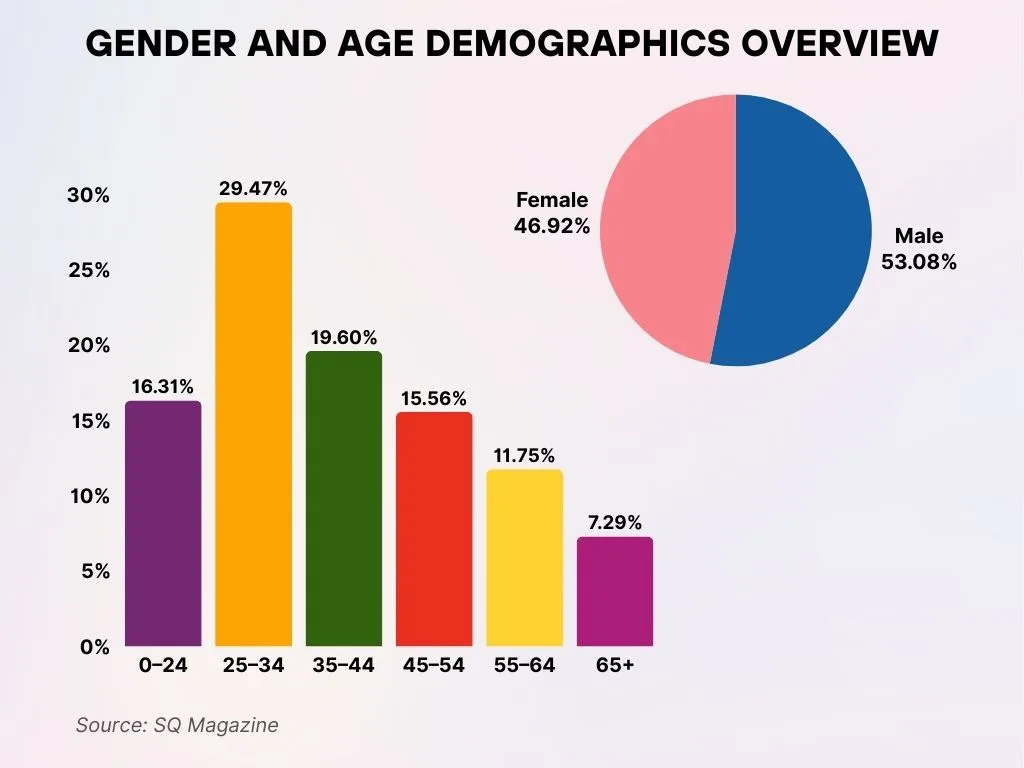
- Male users make up 53.08%, while female users represent 46.92%, showing a slightly male-skewed audience.
- Ages 25–34 lead with 29.47% of the total audience.
- Ages 0–24 account for 16.31%, reflecting strong Gen Z engagement.
- Ages 35–44 represent 19.60%, ranking second after the 25–34 group.
- Ages 45–54 make up 15.56%, while 55–64 account for 11.75%.
- Ages 65+ hold the smallest share at 7.29%, showing limited senior participation.
Amazon Overview
- Founded in 1994 with headquarters in Seattle, Washington, Amazon serves as a public company (NASDAQ: AMZN).
- In 2024, Amazon employed more than 1.5 million people globally, many working in fulfilment and delivery roles.
- As of 2025, Amazon operates across dozens of international marketplaces, including major sites in the U.S., Germany, the UK, Japan, and others.
- The company’s business spans three major segments: North America retail, International retail, and AWS cloud services.
- Amazon’s annual revenue for full-year 2024 was $638 billion.
- The International segment contributed $142.9 billion in sales in 2024, up 9% from 2023.
- Over 9.7 million sellers are registered globally on Amazon’s marketplace platform.
Market Cap and Company Valuation
- As of July 2025, Amazon’s market capitalisation hit $2.36 trillion, ranking it among the top-valued public companies globally.
- Amazon’s net income in 2024 reached $59.2 billion, nearly double the 2023 level of $30.4 billion.
- Operating income for 2024 was $68.6 billion, representing about a 10.8% operating margin.
- AWS growth remains a key driver of value: AWS revenue for 2024 was $107.6 billion, up 19% from the year prior.
- Analysts estimate that for full-year 2025, Amazon’s revenue could approach $700 billion, supporting stronger valuation metrics.
- Amazon’s U.S. e-commerce leadership with ~40% market share supports investor confidence in its dominant position.
- The company’s diverse business model (retail, cloud, advertising) enhances its valuation beyond pure retail metrics.
US E-commerce Market Share Overview
- Amazon leads the market with a dominant 37.6% share, solidifying its position as the largest online retailer in the United States.
- Walmart ranks second with 6.4%, reflecting its growing omnichannel and online presence.
- Apple captures 3.6%, driven by strong device and accessories sales through its digital store.
- eBay holds 3.0%, maintaining relevance through resale and auction-based commerce.
- Other retailers collectively account for 49.4%, highlighting a highly fragmented market beyond the top players.

Global and Regional Sales Figures
- In Q2 2025, Amazon’s North America segment generated $100.1 billion, up 11% from Q2 2024.
- The International segment posted $36.8 billion in net sales in Q2 2025, representing a 16% year-on-year increase.
- Full-year 2024 sales: North America $387 billion (+10% YoY), International $143 billion (+9%).
- U.S. sales for Amazon in 2024 stood at approximately $438 billion, while Germany contributed ~$40.9 billion and the UK ~$37.9 billion.
- Projections for U.S. Amazon retail e-commerce sales in 2025 estimate ~$540.3 billion with a 40.9% market share.
- Amazon’s global customer base exceeds 310 million active users, with around 230 million in the U.S.
- Mobile device traffic comprises over 53% of Amazon’s website visits as of 2025.
- Independent sellers in the U.S. averaged more than $290,000 in annual sales in 2024.
Amazon Prime Membership Statistics
- Worldwide, Amazon Prime had over 240 million members in 2025.
- In the U.S., membership reached approximately 180.1 million in 2024 and is projected to be about 185 million in 2025.
- A survey from March 2025 estimated about 196 million U.S. Prime users, representing ~9% growth year-on-year.
- U.S. adult internet users aged 18-34 have about 81% penetration of Prime membership.
- The average annual spend of a U.S. Prime member in 2024 was about $1,170, compared with $570 for non-Prime shoppers (approx. 2:1 ratio).
- Prime revenue reached approximately $44.374 billion in 2024.
- About 42% of U.S. Prime users hold a yearly subscription, while ~58% use monthly billing.
- Across U.S. households, more than 80 million are estimated to have a Prime subscription.
Most Popular Product Categories
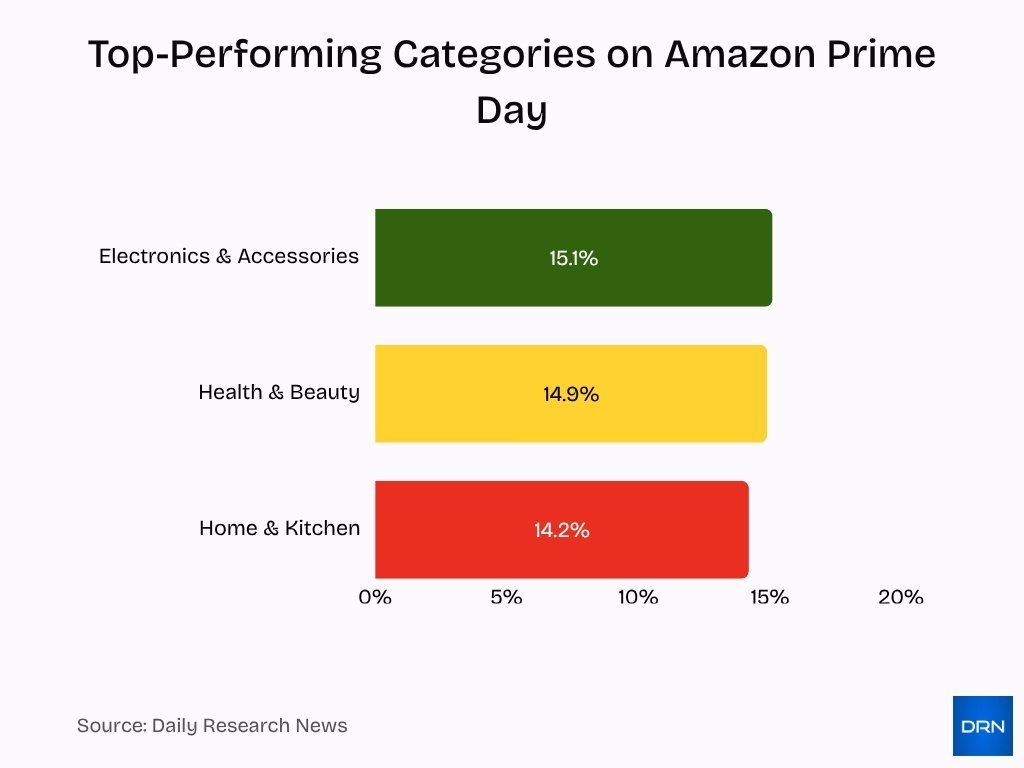
- Top-performing categories for Prime Day 2025 included Electronics & Accessories (15.1%), Health & Beauty (14.9%), and Home & Kitchen (14.2%).
- On the platform of Amazon, electronics and gadgets account for about 50% of product search volume.
- Home and kitchen appliances, along with smart-home devices, remain among the fastest-growing categories, with year-on-year growth exceeding 12% in 2024 (estimated).
- Fashion and apparel categories grew roughly 8% in 2024 as more shoppers moved online.
- Consumables and grocery items increased by about 10% in the U.S. in 2024, reflecting the service expansion of same-day and two-day delivery.
- The toys and games category spending peaked during the holiday quarter, posting growth of about 15% in Q4 2024 versus Q4 2023.
- Health and personal care e-commerce on Amazon rose ~9% globally in 2024.
- Third-party seller goods (across many categories) now represent around 60% of items sold on Amazon.
- Mobile device accessories (cases, chargers) grew at ~17% in 2024 on Amazon’s platform, as smartphone adoption and replacement cycles accelerated.
Top-Selling Products on Amazon
- The best-selling product types on Amazon in the U.S. include smart speakers, wireless earbuds, and streaming devices, collectively capturing over 20% of units sold in electronics in 2024.
- Books remain a solid category, with Amazon selling approximately 100 million titles in 2024 worldwide.
- Home cleaning robots and vacuums saw 25% growth in Amazon unit sales in 2024 compared to 2023.
- Kitchen appliances (e.g., air-fryers, espresso machines) were among the top-20 fastest-selling products on Prime Day 2025.
- Pet supplies and accessories posted around 14% year-on-year growth in 2024 via Amazon.
- Health-monitoring devices (wearables, smart scales) were up about 22% on Amazon’s platform in 2024.
- Video game consoles and accessories reached a combined hardware/software revenue exceeding $6 billion globally via Amazon in 2024.
- Seasonal items (holiday decorations, outdoor gear) accounted for roughly 18% of total Prime Day-era sales in 2024.
Advertising Revenue
- Amazon’s retail-media advertising revenue is forecast to exceed $60 billion in 2025.
- For 2024, Amazon’s ad revenue was estimated at $56.2 billion.
- Advertising revenue grew about 18% year-on-year in 2024.
- Amazon is projected to capture nearly 40% of global retail-media ad spending in 2025.
- In Q-specific data, the ad business met or slightly missed expectations in Q1 2025 at ~$17.3 billion.
- Advertising on Amazon’s own streaming and video platforms is growing faster than its core retail advertising business.
- Sponsored product ads (third-party sellers) now make up approximately 70% of Amazon’s total ad inventory.
- Brand-direct programs (Amazon DSP, Amazon Stores) grew over 20% in 2024, as brands shift budget from search and social to retail channels.
Amazon Sellers’ Monthly Sales Breakdown
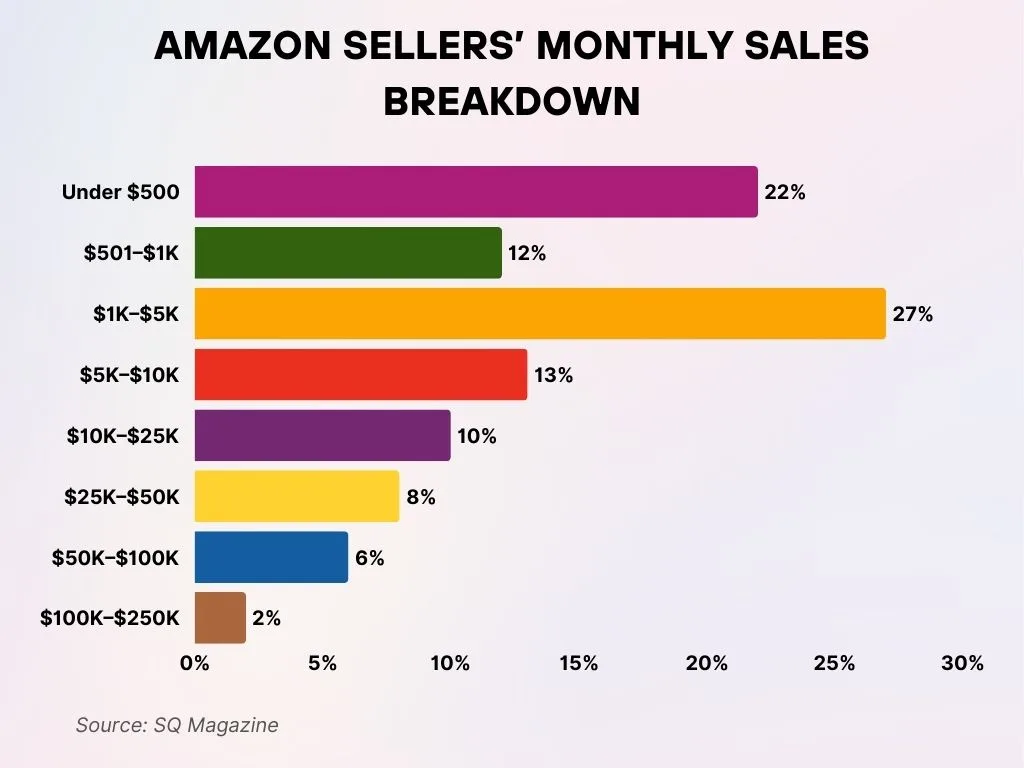
- 27% of sellers earn $1K–$5K per month, forming the largest group of small to mid-level businesses.
- 22% make less than $500 monthly, reflecting many low-volume or new sellers.
- 12% earn $501–$1K per month, representing modest-scale operations.
- 13% generate $5K–$10K monthly, showing steady mid-tier performance.
- 10% record $10K–$25K in monthly sales, marking higher active sellers.
- 8% earn $25K–$50K, while 4% make $50K–$100K monthly.
- Only 1% achieve $100K–$250K in monthly revenue, representing top-tier performers.
Amazon App Downloads and Web Traffic
- The Amazon Shopping mobile app has amassed over 500 million downloads on Google Play alone.
- In May 2025, Amazon’s website attracted about 2.8 billion visits globally, with 57% of that traffic coming from mobile devices.
- In October 2025, Amazon.com recorded ~2.767 billion visits for that month.
- The bounce rate on Amazon.com was approximately 30.7%, with an average session duration of ~6 minutes.
- Mobile app usage: around 98 million people access the Amazon app at least once per month in 2025.
- The Amazon Shopping app ranked among the top 3 shopping apps in the U.S. App Store as of mid-2025.
- In the U.S., about 63% of customers begin their product search on Amazon’s website or app rather than a general search engine.
Employment and Workforce Data
- As of early 2025, Amazon employed approximately 1.556 million full- and part-time workers globally.
- In 2024, the employee count increased by ~2% from 2023 to 1.556 million.
- Roughly 1.1 million of those employees are estimated to be based in the U.S. as of the latest data.
- Corporate layoffs announced in 2025 included about 14,000 jobs, roughly 0.9% of Amazon’s total workforce.
- In its 2024 workplace review, Amazon reported women in the U.S. earned $0.999 for every dollar paid to men in comparable roles.
- The average tenure of hourly front-line employees remains around 2.3 years, reflecting high turnover in logistics and delivery roles.
- Amazon’s investment in hiring seasonal workers for peak periods (e.g., holiday logistics) in 2025 is projected to exceed 250,000 additional roles.
- The warehouse and fulfilment workforce accounts for roughly 60% of total global employment at Amazon, with technology and corporate roles making up the remainder.
Top Reasons Why Consumers Prefer Shopping on Amazon
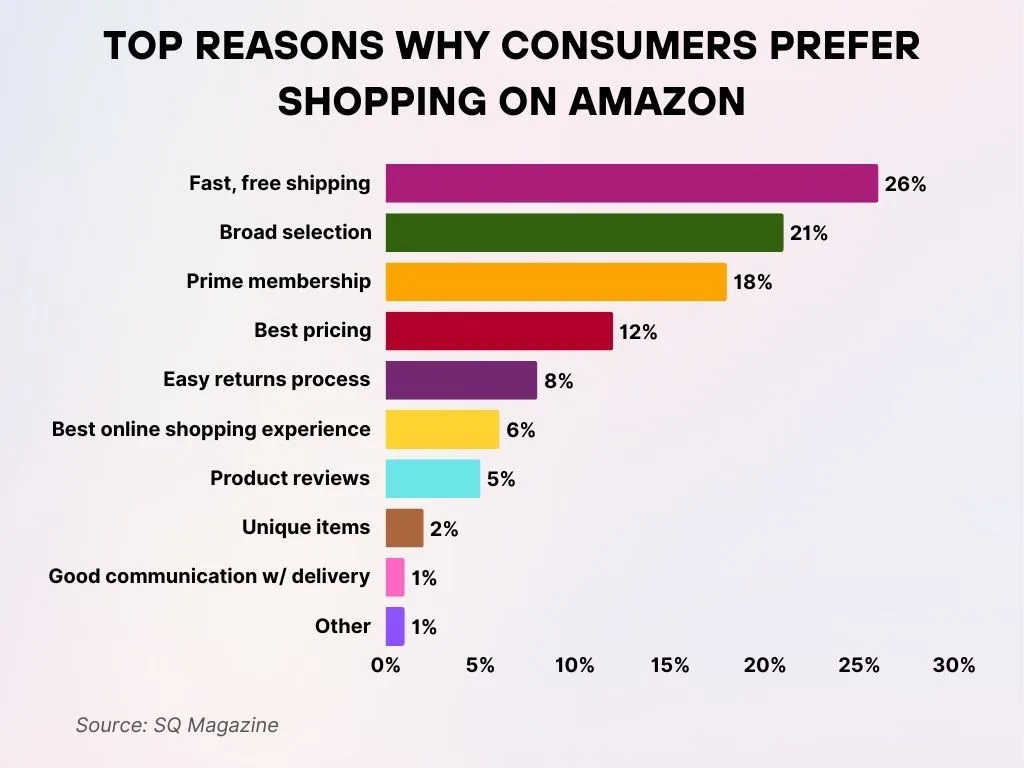
- 26% choose Amazon for fast, free shipping, its biggest competitive edge.
- 21% value its wide product selection, offering everything in one place.
- 18% are drawn by Prime membership perks, like exclusive deals and faster delivery.
- 12% cite competitive pricing as a major reason for shopping on Amazon.
- 8% appreciate the easy returns process for hassle-free refunds and exchanges.
- 6% believe Amazon provides the best overall online shopping experience.
- 5% rely on product reviews to make informed purchases.
- 2% shop to find unique items unavailable elsewhere.
- 1% value good communication and delivery updates.
- 1% list other miscellaneous reasons, showing niche motivations.
Fulfillment and Logistics Statistics
- As of 2024, Amazon Logistics processed approximately 11,954 U.S. delivery orders per minute, about 199 orders per second.
- In 2024, around 28.2% of all U.S. packages shipped passed through Amazon’s own logistics network.
- Globally, Amazon is projected to ship 20–25 million packages per day in 2025, equating to roughly 231 packages every second.
- As of April 2025, Amazon operates about 1,200 logistics facilities worldwide, including fulfillment centers, sortation hubs, and delivery stations.
- Same-day or next-day delivery coverage in over 140 U.S. metropolitan areas, serving approximately 75 million Americans, with around 60% of prime orders in the top 60 metros delivered in that timeframe.
- On-time delivery across many regions reaches 90-98%, reflecting improvements in routing, fulfillment location placement, and logistics automation.
- The growth in package volume has moderated. Amazon’s U.S. package volume grew about 6.78% from 2023 to 2024, compared with 15.7% growth from 2022 to 2023.
- Amazon has begun deploying advanced AI in logistics to optimise where goods are stored and how routing is done to improve same-day delivery and reduce costs.
Amazon Physical Stores and Retail Expansion
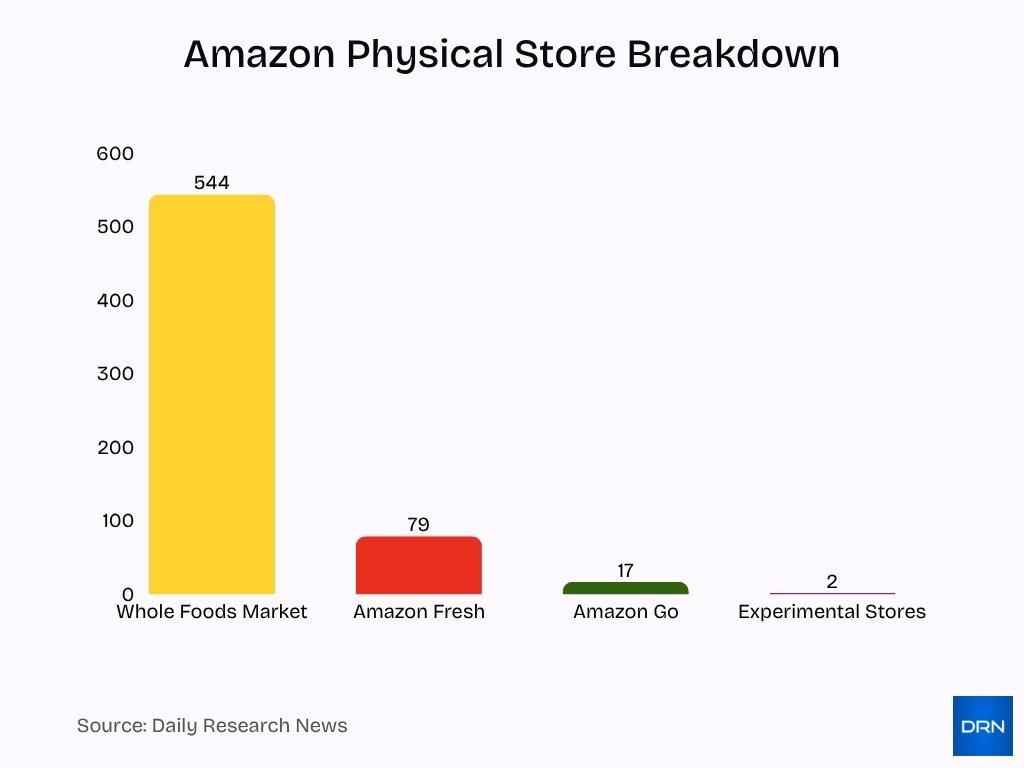
- Amazon operated over 642 physical store locations globally in 2025, including Whole Foods, Fresh, Go, and experimental shops.
- Whole Foods Market accounts for 544 stores, Amazon Fresh 79 stores, and Amazon Go 17 locations across the U.S.
- Amazon Fresh and Whole Foods will serve 2,300 U.S. cities with grocery services by the end of 2025.
- Amazon’s physical stores generated approximately $5.533 billion in revenue for Q1 2025.
- The company closed 8 of 29 Amazon Go stores in early 2025 as part of restructuring its physical retail footprint.
- Same-day grocery delivery from Amazon Fresh expanded from 1,000 to 2,300 cities in 2025.
- Amazon emphasizes physical stores as fulfillment, pick-up, and return hubs rather than pure retail destinations.
- Approximately 80% of shoppers prefer frictionless cashierless technology, which Amazon integrates variably across store formats.
- Amazon’s capital expenditure is expected to surpass $100 billion in 2025, largely invested in AI and retail tech innovation.
- Physical store sales rose 7% year-over-year to $5.6 billion in Q3 2025, supporting the online-to-offline hybrid model.
Environmental and Sustainability Initiatives
- Amazon aims for net-zero carbon emissions by 2040, 10 years ahead of the Paris Agreement.
- Global operations reached 100% renewable electricity usage in 2023, two years early.
- Amazon invested in 230+ renewable energy projects in Europe, adding nearly 1 GW of capacity.
- The “Climate Pledge Friendly” label features 1.4 million sustainable products to guide customers.
- Packaging optimization reduced waste per shipment by 41% in 2024.
- Waste diversion rate improved to 85% in 2024, increasing yearly.
- The 2025 Climate Tech cohort includes 11 companies focused on innovative sustainability solutions.
- Amazon ordered over 100,000 electric delivery vans to electrify its delivery fleet.
- Suppliers responsible for 50% of supply chain emissions are required to have decarbonization plans.
- Amazon has achieved 53% of its water positivity goal as of 2024, targeting 2030.
Key Amazon Acquisitions
- Amazon acquired robotics startup Covariant, expanding its AI and robotics team by about 25% in 2024.
- Amazon MGM Studios produces over 20 original series and films annually, fueling Prime Video content growth.
- Amazon bought several logistics software firms in 2025 to enhance last-mile delivery efficiency.
- The acquisition of Longitudinal Robotics added advanced warehouse automation capabilities in 2025.
- Amazon invested over $2 billion via the Climate Pledge Fund in clean-tech startups since its inception.
- AI-enabled inventory optimizer acquisitions aim to reduce logistics costs by up to 15%.
- Amazon has completed 100+ acquisitions since 2010, focusing on robotics, cloud, and media.
- MGM Studios’ content contributed to a 15% increase in Prime Video subscriptions in 2025.
- Startups in Amazon’s 2025 Sustainability Accelerator cohort include 11 companies innovating in water and waste tech.
- Amazon’s delivery network acquisitions helped grow its private fleet to over 40,000 vehicles in 2025.
Amazon Innovations and Patents
- The company’s robotics fleet surpassed 750,000 robots as reported in 2025, suggesting increasing automation in fulfillment centers.
- Amazon is testing humanoid delivery robots as part of next-gen last-mile delivery.
- Amazon uses AI models that optimise product placement, predict demand, and route delivery to reduce delivery distance by approximately 10% annually in some markets.
- Amazon’s patent filings show increased frequency in “just-walk-out” retail technology, automated returns, and smart-cart systems.
- Amazon’s warehouse automation innovations include containerised storage (“Sequoia” system) and pick-and-place robotic arms to reduce labour intensity and improve throughput.
- The company is investing in digital twin simulations of its logistics network to test new routing and fulfillment strategies before deployment.
Prime Day and Shopping Events Statistics
- Prime Day 2025 was expanded to a four-day format and became Amazon’s largest shopping event to date, with customers saving billions across millions of deals.
- In 2025, U.S. online spending during Prime Day reached approximately $24.1 billion, up 30.3% from the previous year.
- During Prime Day 2025, average daily orders were 136% higher than the year-to-date daily average, though lower in relative spike than in prior years due to the longer event window.
- Independent sellers recorded record volumes of items sold during Prime Day 2025, marking their strongest event performance ever.
- Retailers report that discount depth averaged around 21.7% on Amazon U.S. during Prime Day 2025, with only a small share of products seeing deeper than 20% reductions.
- Over 150,000 orders were placed by a sample of U.S. households during Prime Day 2025, with an average order value of around $53.34.
Frequently Asked Questions (FAQs)
They reached $155.7 billion, up 9% year-on-year.
It is projected to be 40.9% of U.S. retail e-commerce sales.
It is estimated at about $700 billion for 2025.
Projected U.S. ecommerce sales are about $540.29 billion, representing 40.9% of total U.S. retail ecommerce sales.
Conclusion
Its logistics network is now shipping millions of packages daily, while its physical-retail strategies evolve and its sustainability commitments deepen. From automation in warehouses to expanded same-day delivery and record-breaking shopping events, Amazon continues to push the boundaries of retail, cloud, and consumer behaviour. For brands, sellers, and analysts, these statistics signal opportunities and challenges alike, and the data above provides a clear foundation for navigating them.


