Apple Inc. continues to dominate in hardware, services, and global market reach, while also facing fresh challenges across supply chains and regulation. From its latest fiscal quarter performance to its evolving App Store ecosystem, the data reveals how Apple’s business is shifting. The company’s success in premium devices and recurring services powers use cases such as enterprise device deployment and consumer digital subscriptions. Now, let’s dive into the full article and explore the numbers driving Apple’s business forward.
Editor’s Choice
- Apple posted $102.5 billion in revenue for fiscal Q4 2025, up about 8% year‑over‑year.
- App Store global billings for digital goods reached $91.3 billion in 2024; Apple’s commission exceeded $27.4 billion globally.
- Digital goods and services via the App Store grew by 109% from 2019 to 2024.
- Physical goods and services via the App Store ecosystem grew by 162% in the same period.
- Apple’s services gross margin for the period was about 75%, markedly higher than hardware margins, underscoring the segment’s profitability.
Recent Developments
- In Q4 2025, Apple again highlighted strong services performance, even as hardware growth faces macro‑headwinds.
- Apple’s effective tax rate for 2025 dropped to 15.6%, down from 24.1% in 2024.
- Developer ecosystem data shows the App Store now supports over 2 million apps globally as of 2025.
- Consumer behaviour is shifting; in‑app advertising revenue on iOS grew 131% from 2019 to 2024 in the App Store ecosystem.
- Regionally, in 2024, the U.S. accounted for ~$406 billion of App Store ecosystem activity, and China ~$539 billion.
- Apple is increasingly investing in Artificial Intelligence features for its ecosystem and devices, signalling a strategic pivot.
- Analysts expect services to approach or surpass $100 billion in annual revenue soon.
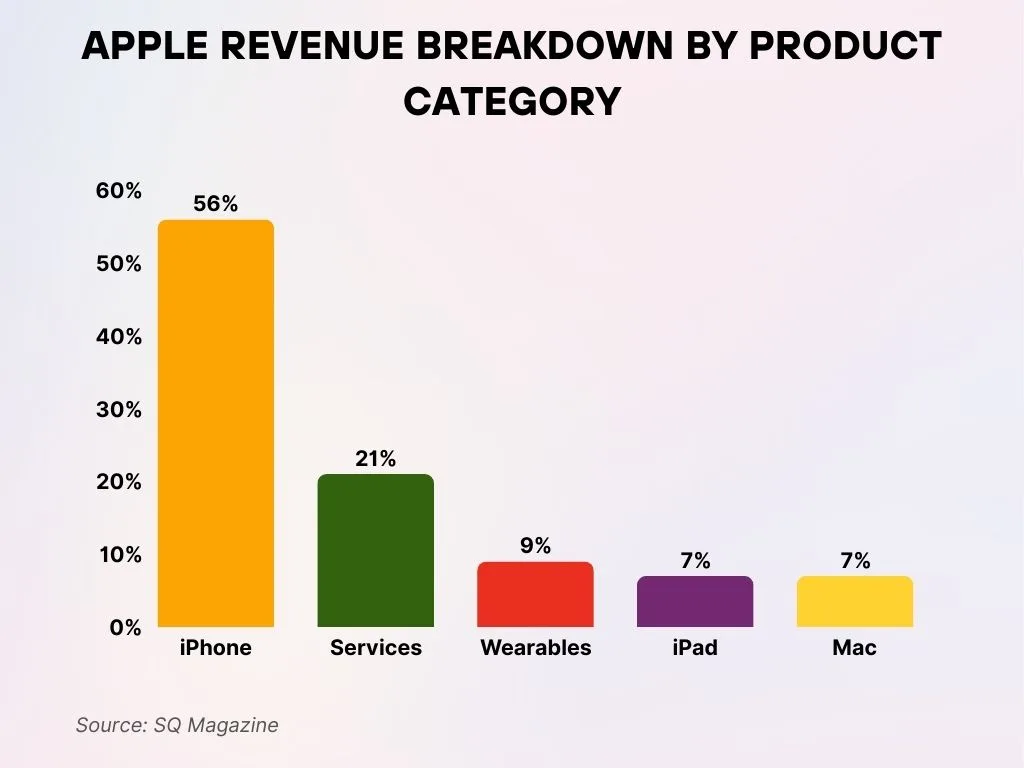
Apple Revenue Share by Product Line
- iPhone contributes 56% of Apple’s total revenue, remaining its top earner.
- Services generate 21%, reflecting the rise of Apple’s digital ecosystem.
- Wearables hold a 9% share, led by Apple Watch and AirPods.
- iPad accounts for 7%, showing stable performance within the lineup.
- Mac also holds 7%, driven by steady demand for Apple’s computers.
Revenue Statistics
- Apple’s annual revenue in 2023 was about $383.2 billion.
- In Q4 2025, quarterly revenue stood at $102.5 billion, up approximately.
- Apple’s revenue from Japan in Q3 2025 was ~$5.78 billion (~6.2% of the quarter’s revenue).
- Revenue in the Rest of Asia Pacific region in Q3 2025 hit ~$7.67 billion (~8.16%).
- Apple’s global revenue ranking in 2025 puts it in the company of the world’s largest tech firms by revenue.
Apple Services Growth Metrics
- In Q3 2025, services revenue reached an all‐time high (approximately $27.42 billion), up ~13% year‐over‐year.
- Services growth rate for the quarter ended September 30, 2025, was approximately 15.85% compared to the same period prior year.
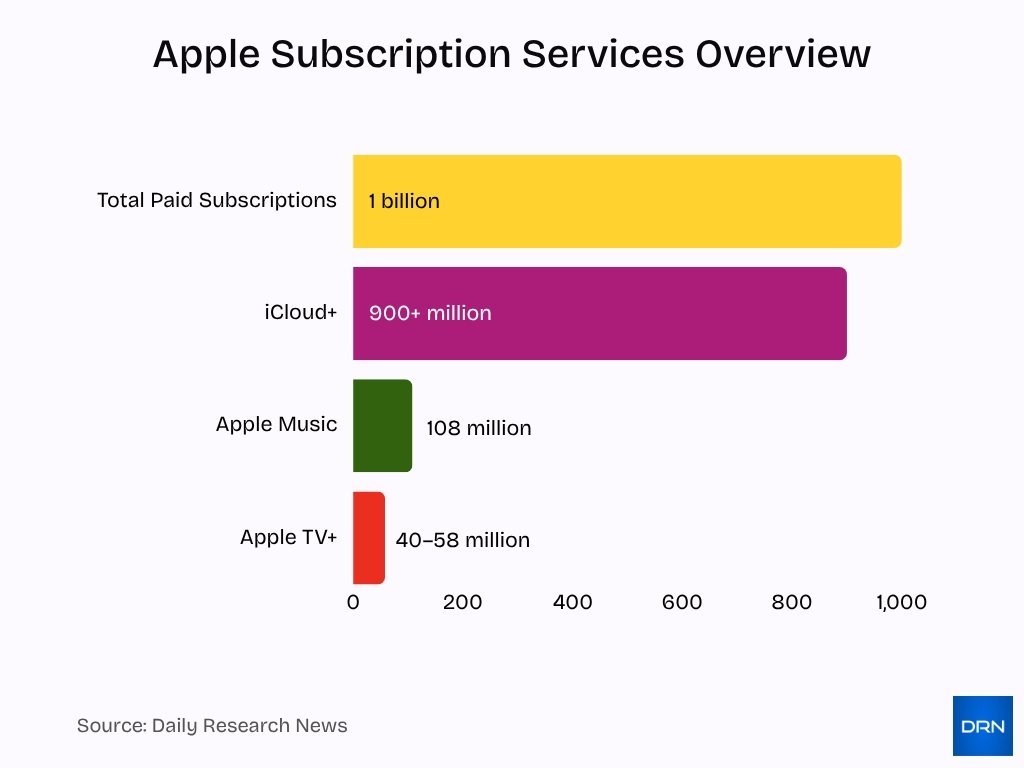
- The company reported more than 1 billion paid subscriptions across its services ecosystem as of mid‑2025.
- Subscriptions within the services segment grew by approximately 15% year‐over‐year in certain regions.
- Analysts forecast the services segment could reach $175 billion annually by the end of the decade, making it a key driver of Apple’s future growth.
App Store Statistics
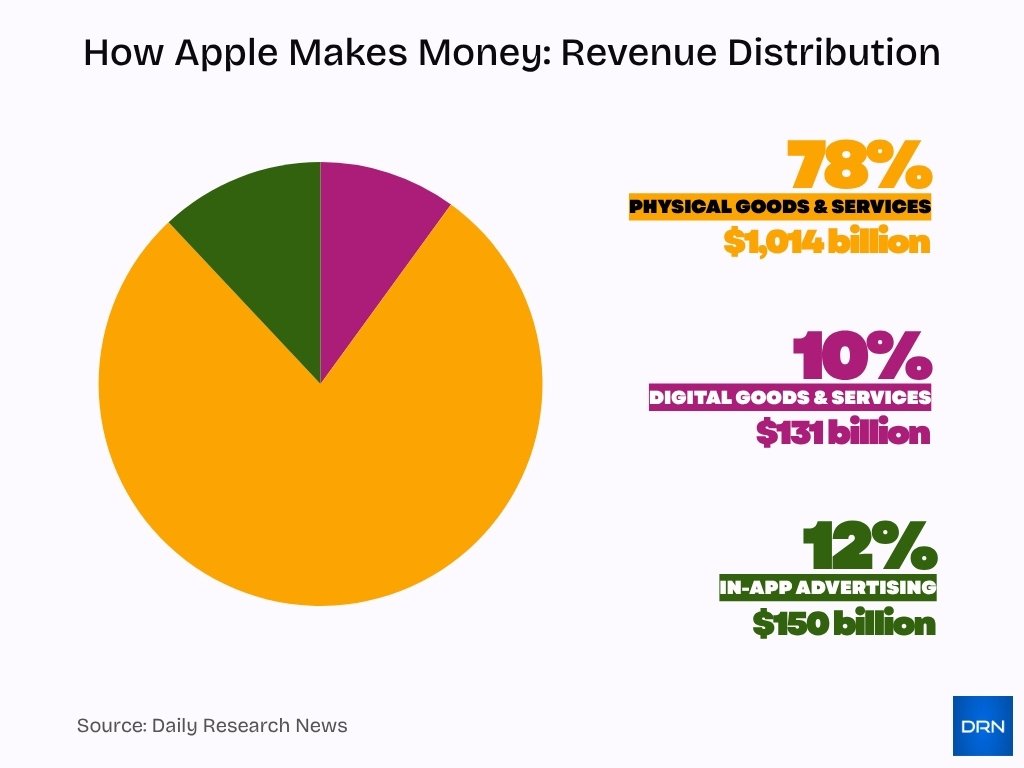
- Approximately $131 billion or ~10% stemmed from digital goods and services, ~$1,014 billion (~78%) from physical goods and services, and ~$150 billion (~12%) from in‑app advertising.
- In 2023, the App Store generated ~$89.3 billion in consumer spending, a ~2.8% increase on the previous year.
- As of early 2025, the App Store hosted around 1.9 million to 2.0 million apps and games.
- Downloads are running in the tens of billions annually; one estimate places ~38 billion yearly downloads in 2025.
- In‑app advertising revenue has grown ~131% since 2019 for the App Store ecosystem.
- Regionally, in 2024, the U.S. accounted for ~$406 billion in billings via the App Store ecosystem, China ~$539 billion, and Europe ~$148 billion.
- Developers are reaching billions of dollars via App Store payouts; for example, the U.S. App Store alone facilitated ~$406 billion in developer billings and sales in 2024.
App Store Revenue and Developer Earnings
- According to a 2024 Apple report, the App Store ecosystem’s facilitated sales and billings permitted more than 90% of transactions with no commission taken by Apple on those sales.
- A third‑party analysis found Apple earned $27.39 billion in app store commissions globally in 2024.
- Global app store revenue for digital goods and services reached ~$131 billion in 2024.
- Global developer billings and sales via the App Store physical goods and services channel exceeded ~$1 trillion in 2024.
- The App Store Small Business Program (commission rate reduced to 15% for developers earning under $1 M) covers the “vast majority” of developers.
- In the U.S., the App Store ecosystem’s facilitated billings helped developers generate ~$406 billion in 2024.
- Developer payouts are increasingly tied to subscriptions and recurring revenue rather than one‑time purchases, aligning with services growth trends.
Subscription Services Statistics
- Apple’s total paid subscriptions across offerings surpassed 1 billion units by mid‑2025.
- iCloud+ accounts grew ~15% year‑over‑year as of early 2025 with over ~900 million active user accounts reported.
- Apple Music reached roughly 108 million subscribers in 2025.
- Apple TV+ subscriber estimates are ~40‑58 million.
- The bundled subscription option “Apple One” is driving cross‑service adoption and higher average revenue per user.
- Specific growth in regional subscription adoption is strongest in the U.S. and Europe, with emerging markets showing double‑digit growth.
- Apple Pay shows growing integration into the subscription ecosystem. In the U.S., Apple Pay holds ~54% share of in‑store mobile wallet usage.
- Analysts expect subscription services to become an even larger share of total revenue, potentially exceeding 30% of Apple’s net sales within the next few years.
Apple Store and E‑commerce Insights
- As of July 2025, Apple Inc. operated approximately 535 retail stores in 27 countries.
- The U.S. accounts for about 272 Apple Stores, with the remainder distributed globally.
- In 2025, global retail online sales are projected to reach around $6.42 trillion, up ~6.9% from 2024.
- In the U.S., online retail is expected to hit approximately $1.47 trillion in 2025, representing ~18.4% of total retail sales.
- Apple’s retail and e‑commerce channel shows significant online sales growth, though exact company‑specific numbers are not public.
- The growth of Apple’s retail and e‑commerce platforms complements its services and device business, reinforcing ecosystem stickiness.
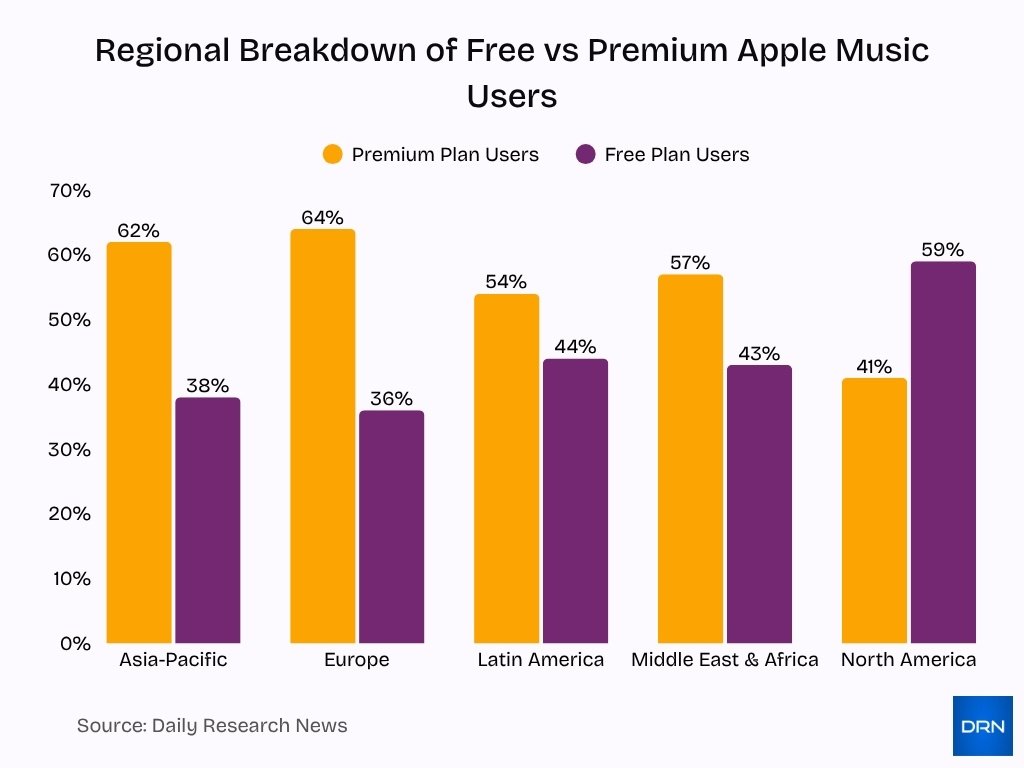
Regional Breakdown of Free vs Premium Apple Music Users
- Asia-Pacific: 62% of users are on Premium Plans, while 38% use the Free Plan.
- Europe: 64% subscribe to Premium, with 36% using the Free Plan, showing the highest premium adoption.
- Latin America: 54% are Premium Users, while 44% remain on the Free Plan.
- Middle East & Africa: 57% of users are on Premium, and 43% use the Free Plan.
- North America: 59% of users prefer the Free Plan, while only 41% are Premium Subscribers, the lowest premium share globally.
Apple’s Global Market Size Forecast
- For fiscal Q4 2025, Apple’s outlook suggests double‑digit growth, with analysts projecting overall revenue growth of ~10‑12%.
- Apple’s market capitalisation reached around $4.025 trillion in November 2025.
- Apple’s services business could reach $175 billion annually by later in the decade.
- Apple’s installed device base is estimated at over 2 billion active devices globally.
- Apple is forecast to sell ~236 million iPhones annually by the end of the decade.
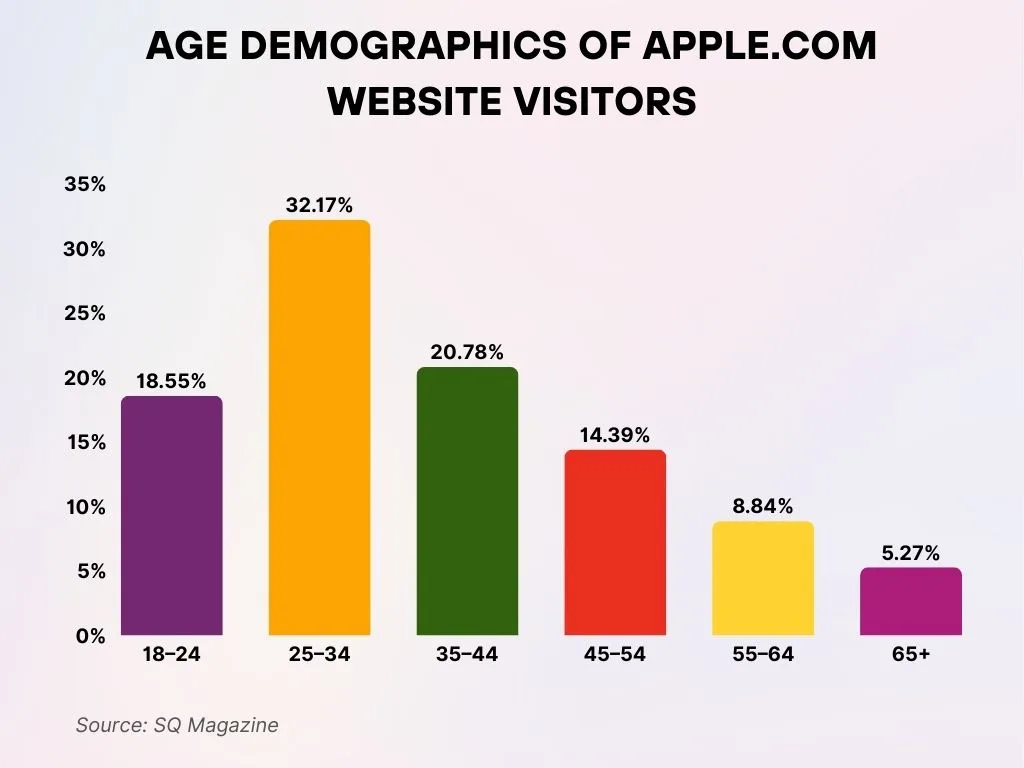
Apple.com Visitor Age Breakdown
- 25–34 makes up 32.17% of visitors, the largest age group on apple.com.
- 35–44 accounts for 20.78%, reflecting strong mid‑career engagement.
- 18–24 represents 18.55%, showing solid traction among younger adults.
- 45–54 contributes 14.39% of total site traffic.
- 55–64 holds 8.84%, indicating moderate activity from older users.
- 65+ forms 5.27%, the smallest share of apple.com visitors.
Environmental and Sustainability Statistics
- Since 2015, Apple has reduced its overall carbon emissions by over 60%.
- Apple has committed to becoming carbon‑neutral across its entire global footprint by 2030.
- Suppliers helped avoid nearly 24 million metric tons of greenhouse gas emissions through clean energy and efficiency upgrades.
- Around 80% of the rare‑earth elements in Apple devices came from recycled sources in 2024.
- Apple’s gross carbon emissions total for 2024 were about 15.3 million metric tons, down ~5% from 2023.
- All of Apple’s direct display suppliers and 26 semiconductor suppliers have committed to reducing their fluorinated‑gas emissions by at least 90%.
- Apple’s “Apple 2030” initiative covers product design, renewable electricity, low‑carbon transportation, and recycled materials.
- Environmental progress increases the “green credentials” of Apple’s brand and may support regulatory alignment and consumer preference shifts.
- Sustainability metrics are becoming an asset for Apple’s corporate image and stakeholder relations.
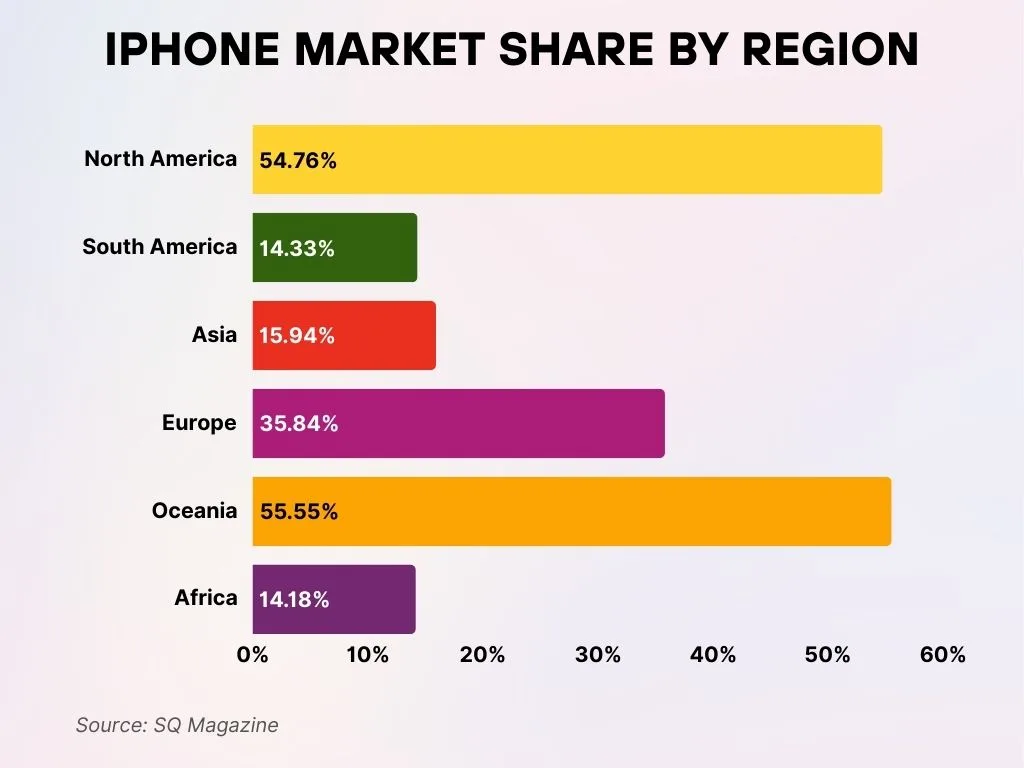
iPhone Market Share Across Global Regions
- Worldwide iPhone share is 27.60%, reflecting a strong global presence.
- Oceania leads with 55.55%, the highest iPhone market share worldwide.
- North America holds 54.76%, showing consistently strong adoption.
- Europe captures 35.84%, maintaining solid regional performance.
- Asia records 15.94%, indicating moderate iPhone usage.
- South America sits at 14.33%, slightly lower but steady.
- Africa posts 14.18%, the lowest iPhone share among all regions.
Stock Performance and Market Valuation
- On October 28, 2025, Apple achieved a market value of $4 trillion.
- Apple’s market cap increased from about $2.994 trillion in 2023 to around $4.025 trillion in late 2025.
- As of late October 2025, Apple’s stock had traded around $265.54, representing a ~15% gain year‑over‑year.
- Valuation strength is attributed to services revenue, iPhone sales, and Apple’s AI strategy.
- Apple’s forward P/E and P/S multiples remain high relative to the broader market.
- Apple’s large install base and recurring‑revenue businesses help smooth earnings.
- Apple accounts for an estimated ~5.9% of the S&P 500 index’s market cap as of Q3 2025.
- Risks include supply‑chain disruption, regulatory scrutiny, macroeconomic headwinds, and competitive threats in AI/hardware.
- Apple’s financial metrics and market perception suggest high investor confidence in the company’s long‑term platform strength.
Frequently Asked Questions (FAQs)
2.35 billion active devices.
About 3.84 million apps.
Approximately $108.6 billion.
Roughly 17%.
Conclusion
Apple continues to demonstrate its dual strengths, hardware leadership through devices like the iPhone, and services expansion via subscriptions, digital content, and the App Store ecosystem. Its global footprint, spanning retail, e‑commerce, and device install base, still offers significant growth potential, even as sustainability and regulatory challenges emerge. For stakeholders seeking insight into Apple’s business trajectory, the data points above provide a grounded view of where the company stands and where it’s headed. Explore the full article to dive deeper into each section and refine your understanding of Apple’s stats.


