
The Google Play Store remains one of the world’s most influential digital marketplaces for mobile apps and games. It continues to shape how billions of users access software, entertainment, and productivity tools. Its impact extends into mobile commerce, where millions of developers monetize creativity, and digital advertising, where app usage drives revenue for brands and platforms. With consumer spending projected to grow and user downloads still rising, many industry players are watching the Play Store closely for opportunities. Explore the stats below to understand the full picture of Google Play’s performance this year.
Editor’s Choice
- Google Play had 1.63 million available apps as of December 2025.
- The platform saw approximately 39,700 new apps launched in November 2025.
- Roughly 16,500 apps were removed in November 2025 due to various reasons.
- Global downloads from Google Play reached 102.4 billion in 2024.
- Google Play revenue was about $46.7B in 2024, with higher expectations in 2025.
- About 97% of all Google Play apps are free to install.
- India, the USA, and Brazil led global download counts in recent years.
Recent Developments
- Google Play apps dropped 47% from 3.4 million to 1.8 million since early 2024.
- 2.36 million policy-violating apps blocked from publication in 2024.
- Over 158,000 bad developer accounts were banned in 2024.
- Nearly 200,000 games were removed from Google Play in 2024.
- 160,700 education apps dropped from listings in 2024.
- 115,400 business category apps vanished in 2024.
- Google Play Protect shielded 10 million devices from 36 million risky installs in 2024.
- 1.3 million apps were prevented from excessive sensitive data access in 2024.
Overview of Google Play Store
- Google Play Store hosts around 1.63 million active apps as of December 2025, following a 47% drop from roughly 3.4 million apps since early 2024.
- Google Play serves 2.5 billion monthly active users worldwide.
- Android commands a 72.77% global smartphone market share in 2025.
- Over 3.3 billion active Android devices power the Play Store reach globally.
- Google Play generated $46.7 billion in revenue during recent years.
- Gaming apps on the Play Store are projected to earn $40.10 billion in 2025.
- Consumers downloaded over 100–102.4 billion apps from the Play Store in 2024.
- 604,116 developers publish apps on the Google Play platform.
- 3,200 new apps launch daily on the Google Play Store.
- 143 billion app downloads projected from the Play Store by 2026.
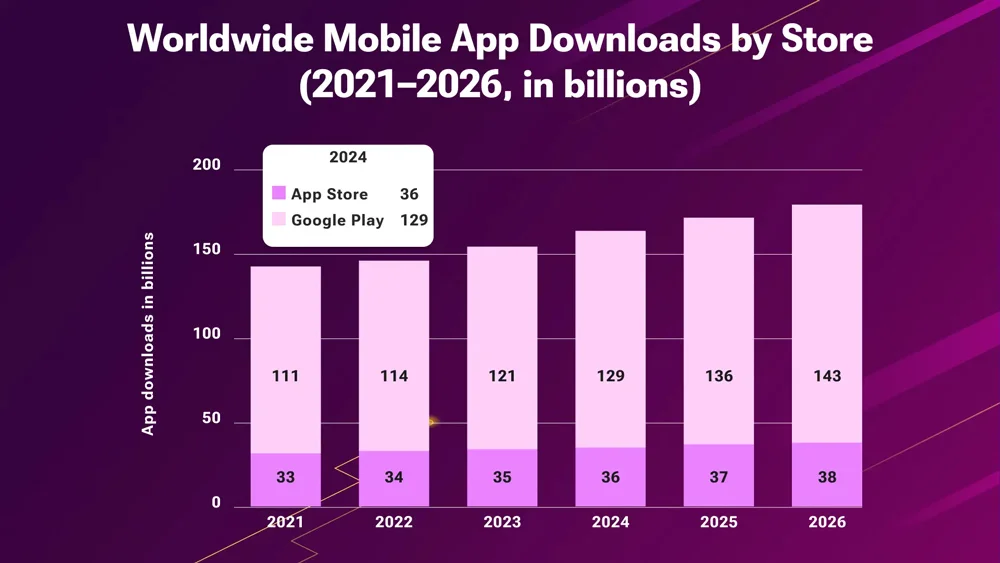
Worldwide Mobile App Downloads by Store (2021–2026)
- Global mobile app downloads show a consistent upward trend, rising from 144 billion in 2021 to 181 billion in 2026.
- Google Play remains the dominant app distribution platform, accounting for the majority of downloads every year.
- Google Play downloads grow from 111 billion (2021) to 143 billion (2026), an increase of 32 billion downloads over the period.
- The Apple App Store also experiences steady growth, increasing from 33 billion downloads in 2021 to 38 billion in 2026.
- App Store downloads rise at a slower but stable pace of about +1 billion downloads per year.
- By 2024, total downloads will reach 165 billion, driven largely by Google Play’s 129 billion downloads.
- The gap between Google Play and the App Store remains significant, highlighting Android’s larger global user base.
- Overall, the data reflects strong global demand for mobile apps, with sustained growth projected through 2026.
- The combined market adds approximately 37 billion new downloads over the six years.

Total Number of Apps on Google Play
- As of Dec 2025, about 1.63M apps were available on the store.
- November 2025 saw ~39.7K new apps published.
- ~16.5K apps were unpublished in Nov 2025, lowering the total app count.
- Net app growth in that month was ~23.3K apps.
- Comparisons vary, but some reports list over ~3.5M historically, reflecting fluctuating data sources.
- App counts change due to policy purges and developer choices.
- Free apps consistently outnumber paid ones by a significant margin.
- Games represent a notable subset of the total store catalog.
Apps Added and Removed Per Month
- ~39,700 new apps launched in Nov 2025.
- ~16,500 apps were removed from the store in the same month.
- Net expansion of apps was ~23,300 in Nov 2025.
- Removal trends include policy violations and quality issues.
- High-volume months show developers remain active despite stricter vetting.
- App replacement cycles are common as developers update or relaunch products.
- Monthly additions fluctuate based on global developer creativity.
- Removals drive up the overall quality of listings over time.
Google Play Users and Reach
- Google Play reaches over 2.5 billion monthly active users globally.
- Android device adoption fuels Play’s broad footprint.
- The U.S., India, and Brazil consistently rank among the top markets for downloads.
- More than 100 billion downloads were recorded from Google Play in 2024.
- Average time spent in apps continues to climb year over year.
- Play Store usage captures a large share of mobile screen time.
- Continued internet penetration suggests future user growth.
- Play remains the default marketplace on most Android devices in the U.S. and globally.
Home Screen App Placement Preferences and Key Influencers
- 80% of users deliberately reposition apps to their home screen, reflecting a +5 percentage point increase compared to 2016.
- 61% of users state that they move apps primarily based on how frequently they use them.
- 54% of users prioritize easier access as a key factor when deciding app placement.
- 49% of users rearrange apps because they require quick access to them.
- 34% of users make their placement decisions based on their interest in the app or the type of app.
- 18% of users select app placement depending on how the app logo appears on their home screen.

Google Play Market Share vs Other Stores
- The Google Play Store holds approximately 59.4% market share among global mobile app stores in 2025.
- Android’s OS market share sits near 73.9% worldwide, boosting Play distribution.
- Apple’s App Store captures a higher revenue share but a smaller download share.
- Play accounted for ~102.4 billion downloads, compared with far fewer on iOS.
- App download share in Asia-Pacific, North America, and Latin America favors Play.
- Emerging app stores collectively represent less than 15% of overall downloads.
- Play remains the default marketplace on most Android devices outside China.
- Alternative stores in China operate independently of Google Play.
Demographics of Google Play Users
- Google Play serves 2.5 billion active monthly users across 190+ countries.
- Android commands a global market share of 72.15% as of January 2025.
- In Asia, Android holds an 82.03% market share, the strongest among regions.
- Africa sees Android dominance at 85.15% mobile OS market share.
- South America’s Android penetration reaches 86.66% of the market.
- India accounts for 44% of global Android app downloads.
- In the U.S., Android secures 40.74% of the mobile OS share.
- Europe features Android at 65.22% market share versus iOS.
- 25-34 year olds represent 35% of Google Play users worldwide.
- In India, 53.1% of Android users fall in the 18-24 age group.
Google Play App Downloads
- India led with over 14 billion Google Play downloads in H1 2024.
- Brazil recorded around 9 billion app downloads from Google Play in H1 2024.
- The U.S. generated over 4 billion Google Play downloads in the first half of 2024.
- Casual games topped categories with an average of 2 billion Google Play installs in 2024.
- Core gaming apps secured 980 million downloads on Google Play in 2024.
- Social apps achieved over 880 million Google Play downloads in 2024.
- The tools category holds 19.73% of total Google Play downloads globally.
- Communication apps represent 12.59% of Google Play download share.
- Productivity apps account for 12.01% of Google Play downloads.
- An average of 1,708 new apps launch daily on Google Play, fueling downloads.
Top Countries by Google Play Downloads
- India leads with 75 billion mobile app downloads, predominantly from Google Play.
- The United States records 35 billion app downloads, ranking third globally.
- Brazil secures 28 billion downloads, driven by gaming and social apps.
- Indonesia achieves 18 billion downloads with rapid growth in emerging markets.
- China tops overall with 62 billion app downloads in recent years.
- In India, 90% of downloads originate from the Google Play Store.
- Google Play saw 299 billion global installs in 2025, up 8% YoY.
- The top 10 countries average 74% downloads from the Google Play Store.
- India generated more Google Play downloads than Brazil, the US, and Indonesia combined.

Google Play Revenue Overview
- Google Play revenue rose to $46.7 billion in 2024, up from $50.5 billion in prior projections.
- iOS App Store generated $103.4 billion in 2024, over twice Google Play’s total despite fewer downloads.
- Games dominated with 47.22 billion downloads in 2022, rising to 49.32 billion in 2023.
- Strategy games captured 23% of gaming revenue, followed by casino at 18%.
- Non-game apps like shopping led with $33.82 billion in global spend across platforms.
- In-app purchases and subscriptions fueled $150 billion global IAP revenue across iOS and Play in 2024.
- The US topped Play markets with nearly $2 billion in-app revenue in H1 2024.
- India saw Rs 4 lakh crore (~$47.6 billion) from the Play and Android ecosystem in 2024.
- Revenue projected to hit $55.5–$65 billion in 2025 with 10-12% annual growth.
Revenue by App Category
- Games generated $31.37 billion in Google Play revenue in 2022, nearly 74% of total platform earnings.
- Communication apps like WhatsApp and Telegram led downloads with 297 million and 244 million, respectively, in 2023.
- Streaming apps such as Disney+ and HBO Max earned $358 million and $240 million on Google Play in the top-grossing lists.
- Productivity apps contributed to non-gaming revenue of $11.53 billion in 2022 amid remote work trends.
- Health & fitness apps saw 14% uninstall rates, lower than games at 34%, boosting retention revenue.
- Education apps follow cyclical patterns with overall subscriptions hitting $3.9 billion in 2022.
- Travel apps experienced 19% uninstall rates, relying on ad-based revenue streams.
- Niche apps like Google One topped $891 million, capturing growing specialized shares.
- Social networking drove $153.4 billion globally, nearly 30% of all app revenue.
Most Downloaded Apps on Google Play
- TikTok has surpassed 3 billion lifetime downloads on Google Play, leading social media apps.
- Instagram recorded 49 million downloads in January 2025, with 42 million from Google Play.
- ChatGPT topped charts with 52 million global downloads on Google Play in April 2025.
- YouTube mobile app exceeded 10 billion downloads on Google Play as of June 2025.
- WhatsApp Messenger is the leading messaging app with 35.14 million monthly downloads in August 2025.
- Google Chrome surpassed 10 billion lifetime downloads on Google Play by 2025.
- Candy Crush Saga hit 1.99 billion total downloads, with 15.9 million in July 2025.
- Duolingo amassed 500 million+ downloads on Google Play for educational learning.
- Google Play saw 299 billion total app installs in 2025, up 8% year-over-year.

App Monetization on Google Play
- Nearly 97% of apps on Google Play are free to download as of January 2025.
- Subscription models generated significant revenue growth, with Google Play reaching $50 billion total in 2024.
- Ad revenue drives nearly 50% of mobile gaming income alongside in-app purchases.
- Freemium apps account for 98% of Google Play revenue worldwide.
- Paid apps comprise just 3% of total listings but persist in professional categories.
- Free apps generate 98% of Google Play Store revenue through in-app models.
- Regional pricing boosted revenue by 22% on Google Play in optimization tests.
- Google offers a 15% service fee for developers’ first $1M in annual earnings.
Pricing Breakdown of Google Play Apps Below $10
- 33.4% of Google Play apps are priced below $1, making ultra-low-cost apps the largest segment of the overall market.
- 26.5% of apps fall in the $1 – $2 range, strongly appealing to budget-conscious users who want premium features at a minimal cost.
- 13.6% of apps are priced between $2 – $3, providing mid-tier pricing for more advanced or niche applications.
- 7.3% of apps cost $3 – $4, representing a smaller yet still significant share of total app purchases.
- 7.2% of apps fall within the $4–$5 range, primarily catering to specialized or feature-rich applications.
- 3.4% of apps fall between $5 – $6, indicating limited demand for higher-priced apps under $10.
- Only 2.4% of apps are priced $7 – $8, making this range the least common category among sub-$10 apps.

Average Revenue per User (ARPU)
- Global Google Play consumer spend hit $46.7 billion in 2024, projected to reach $60-65 billion by 2025.
- North America and Europe deliver the highest ARPU at $9.20/month in the US, versus lower emerging market rates.
- Emerging markets like India and Brazil show lower ARPU but drive 22% YoY revenue growth in Southeast Asia.
- Subscription apps generate 2-3x higher ARPU than ad-only models in Google Play games.
- Hybrid monetization boosts ARPU 28% higher than IAA-only in hypercasual apps.
- Games category leads with $40.10 billion projected 2025 revenue, averaging $1.70 ARPU globally.
- South Korea tops regional ARPU at $12.40/month, driven by high disposable income.
- ARPU growth accelerates 12-15% YoY, tied to retention, yielding 42% lifts via optimized bidding.
Top Grossing Apps on Google Play
- TikTok generated $1.123 billion from in-app purchases on Google Play in Q4 2024.
- Google One earned $216.45 million in global revenues through Google Play in August 2025.
- Google Play Store hit $46.7 billion in revenue in 2024, projected at $60-65 billion for 2025.
- MONOPOLY GO! leads top-grossing games with $3.51 billion lifetime revenue on mobile platforms.
- Honor of Kings tops all-time earners at $13.25 billion across app stores, including Google Play.
- Royal Match generated $3.27 billion in lifetime revenue, dominating puzzle game revenues.
- Candy Crush Saga amassed $7.69 billion in lifetime sales, proving match-3 dominance.
- PUBG MOBILE secured $9.01 billion in lifetime revenue on Google Play and others.
- Games drive 80%+ of Google Play top-grossing charts globally.
Google Play Ratings and Reviews
- Nearly 49% of Google Play apps (1,051,564 out of 2,140,662) have received at least one user rating.
- Over 50% of apps (1,089,098) on Google Play remain completely unrated.
- Apps rated below 3 stars lose all visibility in Google Play’s Explore section.
- 77% of users avoid downloading apps with ratings under 3 stars on Google Play.
- Only 13-18% of developers respond to user reviews on Google Play.
- 97% of Google Play app reviews receive no developer response.
- Higher-rated apps (4+ stars) achieve significantly better download performance and visibility.
- 48% of users skip apps rated below 4 stars on Google Play.
- Gaming apps average 4.2 stars with 2.5 million reviews on Google Play.
Developer Statistics on Google Play
- Over 3 million developers actively publish apps on Google Play, fueling a vast ecosystem.
- 53,165 new apps launch on Google Play each month, averaging 1,708 daily releases.
- Google blocked 2.36 million policy-violating apps, reshaping the developer landscape through stricter quality checks.
- Play Console equips developers with advanced analytics and monetization tools for app optimization.
- Developers increasingly adopt AI-driven personalization, with Google integrating Gemini models for app features.
- Google’s Apps Accelerator supports early-stage developers from 60+ countries via 12-week mentorship programs.
- Policy compliance challenges persist, with over 2 million apps removed annually for violations.
- Average app 30-day retention stands at 5.7%, prioritizing lifetime value over install volume.
- 632,521 publishers contribute to 2.14 million apps on Google Play, spanning diverse categories.[matters]
Most Frequently Exploited App Categories
- Tool apps are the primary targets, accounting for 39.4% of exploited applications, making them the most frequently attacked category.
- Personalization apps contribute 20.2%, indicating significant vulnerability driven by extensive customization features.
- Photography apps make up 12.8% of exploited categories, as they are often targeted to gain access to user images and device storage.
- Productivity apps represent 9.6%, positioning them as attractive targets for attackers aiming to obtain sensitive business data.
- Health & Fitness apps account for 7.4%, highlighting potential exposure risks involving personal health information.
- Communication apps constitute 4.3%, raising concerns due to their access to messaging content and contact data.
- Art & Design apps stand at 3.2%, making them less common targets but still susceptible to exploitation.
- Entertainment apps are the least targeted category, representing only 2.1% of all exploitation cases.

User Spending Behavior on Google Play
- Global consumer spending on Google Play reached $36.2 billion in Q2 2024, up 12% year-over-year.
- Freemium apps generated 98% of Google Play’s worldwide revenue.
- Games accounted for $40.10 billion in projected 2025 revenue on Google Play.
- North America users show $9.20/month ARPU, the third highest globally after South Korea and Japan.
- Subscriptions charge a 15% service fee from day one, boosting steady revenue streams.
- Personalized offers via high engagement lift retention rates as a key Google Play ranking factor.
- Recurring payments dominate as 98% revenue from free apps’ in-app purchases outpaces one-time buys.
- The US leads revenue generation while India tops downloads, varying by economic factors.
Future Outlook for Google Play Store
- Global app downloads on the Google Play Store are projected to hit 143 billion by 2026.
- Quality control efforts have led to a 47% drop in total apps since early 2024.
- Alternative payment methods like digital wallets will claim 41% of transactions in 2025.
- Emerging markets drive up to 79% of developer revenue from overseas users.
- The AI personalization market grows from $498 billion in 2024 to $521 billion in 2025.
- 71% of users engage more with apps featuring AI-driven personalization.
- Engagement metrics like retention boost rankings, with high rates signaling app quality.
- Competition from stores like Amazon Appstore grows amid stricter Play policies.
Frequently Asked Questions (FAQs)
As of December 2025, the Google Play Store hosts approximately 1.63 million apps.
In November 2025, about 39,700 new apps were launched, and 16,500 apps were removed, resulting in a net growth of 23,300 apps for that month.
Google Play accounted for roughly 102.4 billion total global app downloads in 2024.
In 2024, Google Play generated about $46.7 billion in revenue, while Apple’s App Store achieved approximately $103.4 billion.
Conclusion
The Google Play Store stands as a dynamic and maturing digital marketplace. Downloads remain massive, revenue continues to climb, and developers increasingly focus on subscriptions, retention, and lifetime value. Stricter policies and user feedback systems are shaping a healthier ecosystem. As mobile usage expands globally, Google Play is positioned to remain a cornerstone of the Android economy, offering sustained opportunities for developers, advertisers, and businesses alike.


