Google Search remains the most used search engine worldwide, serving billions of users daily and shaping how people access information. Google processed more than 5 trillion searches globally, a figure that highlights both personal and commercial reliance on its search capabilities.
Businesses depend on Google Search for visibility and leads, while individuals use it for everything from finding local services to global news updates.
Its role in SEO and digital marketing continues to influence online strategies. Explore the following sections to understand the latest Google Search statistics and what they mean for users and industries alike.
Editor’s Choice
- Google Search processed 5 trillion searches globally in 2025, underscoring sustained user demand.
- Daily search volume is estimated at ~14 billion queries per day.
- As of early 2025, Google holds roughly 89–90% of the global search market share.
- Mobile search accounts for ~94% of Google’s mobile search share worldwide.
- Google AI Overviews appear in ~27.5% of US mobile searches, up sharply from the previous year.
- Visual search usage (Google Lens) exceeds 20 billion queries monthly.
- Zero-click searches continue rising, with ~60–65% of all Google searches ending without an external click.
Recent Developments
- In 2025, Google officially reported handling more than 5 trillion searches annually, a benchmark in its long history.
- Daily search volume averages around 14 billion global queries, reflecting growth from prior years.
- AI-generated summaries (AI Overviews) have expanded to cover more query types and show ads in 2025.
- Google’s AI Overviews reach over 1.5+ billion users monthly.
- Search trends increasingly reflect AI and generative query interest, as seen in top searches like “Gemini.”
- The introduction of AI Mode testing (all AI-generated search) indicates continued experimentation.
- Regulatory scrutiny intensified in 2025, with the UK CMA investigating Google’s dominance in search and advertising.
- Emergent AI search competitors like ChatGPT-powered platforms are influencing search dynamics but have yet to significantly dent Google’s core usage.
Overview of Global Search Activity On Google
- Google maintains about 89–90% global search engine market share as of late 2025.
- The platform processes ~14 billion queries per day, translating to immense global activity.
- Annual search volume exceeded 5 trillion queries in 2025, up from previous benchmarks.
- Monthly search volume translates to ~417 billion queries per month.
- Google Search remains the most visited website globally.
- A broad range of topic categories shapes search activity, from tech and sports to politics, as seen in Year in Search trends.
- People across all continents use Google daily, making it a universal gateway to the web.
Search Engine Market Share Comparison: Overall V/s Mobile
- DuckDuckGo maintains a small yet expanding presence, recording 0.8% overall and 0.9% mobile market share, with its privacy-centric positioning resonating slightly more with mobile users.
- Google overwhelmingly leads the search landscape with a commanding 92% overall market share and an even stronger 96% share on mobile, reinforcing its status as the undisputed search leader across all platforms.
- Yahoo retains a limited foothold at 2.8% overall market share, which declines sharply to 1.8% on mobile, highlighting its continued loss of relevance, particularly among mobile-first users.
- Bing represents 3.9% of total search visits overall but drops to just 1.4% on mobile, indicating that while it has some desktop traction, its mobile adoption remains notably weak.


User Reach and Audience Size of Google
- An estimated 5.01 billion people used Google worldwide in 2025.
- Daily active users number in the billions, with some sources citing ~1.7 billion interacting daily.
- Users perform, on average, ~4.2 searches per person each day.
- Google’s reach spans all age groups, with significant engagement among 18–34-year-olds.
- Engagement patterns show gender usage splits (e.g., ~57.9% male, ~42.1% female).
- Google accounts for a large portion of monthly internet activity worldwide.
- Google’s global reach continues to expand with new features and AI enhancements.
Device Usage Patterns in Google Search
- Mobile devices lead usage, with over 60% of Google searches conducted on smartphones in 2025.
- Tablets account for a small portion (<2%) of overall Google search traffic.
- Desktop searches now represent a minority share as mobile dominance continues to grow.
- Voice-activated searches from mobile and smart devices account for an increasing share, contributing to overall search volume growth.
- Smart speaker ownership in U.S. households climbed to ~75% by 2025, driving voice query adoption.
- Local queries from mobile devices now exceed 45% of mobile search activity in the U.S. and Europe.
- Mobile search sessions also trend shorter but more frequent than desktop sessions.
- Image and Google Lens queries are rising rapidly on mobile, with billions of visual searches monthly.
Regional and Country-Level Search Insights
- In the U.S., Google commands an 88% search market share across devices.
- Europe sees Google at 89.5% market share, with Germany at 86.7%.
- India leads with 70% global growth in visual searches via Google Lens.
- Baidu holds 56% search dominance in China across all platforms.
- Africa records 11.2% YoY rise in Google search activity.
- Southeast Asia shows 15% YoY growth in e-commerce search volumes.
- Hindi speakers total 609 million, boosting local language queries.
- U.S. “near me” mobile searches surge over 500% for purchase intent.
- Emerging markets feature higher transactional intent at 15% of queries vs 0.7% globally.
Local Search Volume on Google: Key Statistics
- Google processes over 37,000 local searches every second, highlighting the constant and real-time demand for location-based information.
- More than 2.22 million local searches occur per minute on Google, reflecting massive user reliance on nearby services and businesses.
- Local search activity reaches approximately 133.2 million per hour, demonstrating sustained and high-intent search behavior throughout the day.
- Google handles nearly 3.19 billion local searches each day, underlining the platform’s dominance in local discovery.
- Monthly local searches on Google total around 97 billion, showing the enormous scale at which users seek local results.
- On an annual basis, Google processes an estimated 1.164 trillion local searches, emphasizing the long-term growth and importance of local SEO strategies.

SERP Feature Distribution in Google Results
- AI Overviews appear in 13.14% of all Google searches as of March 2025.
- Featured snippets show up in 19.2% of SERPs in 2025.
- People Also Ask boxes appear on over 80% of SERPs across desktop and mobile.
- Local packs appear for ~20% of queries, dominating visibility for local intent.
- Knowledge panels have a CTR of 2% and appear in about 14% of results.
- Image packs display in 51.6% of SERPs, boosting media-related engagement.
- Video results appear in 4.8% of SERPs but achieve up to 62% CTR for rich content.
- Organic results now account for only ~20% of total SERP elements amid rich features.
Click‑Through Rate Insights on Google Results
- Zero‑click searches climbed to ~65% mid‑2025, reducing CTR for organic content.
- Organic search CTR in the U.S. dropped from 44.2% to ~40.3% between March 2024 and 2025.
- Organic CTR for high-ranking positions (e.g., Position #1) remains significant: ~39.8%.
- Position #2 averages ~18.7% CTR, with sharp declines across lower ranks.
- Featured snippets and AI Overviews influence CTR patterns, often surpassing traditional first organic results.
- Paid search CTR is modest relative to organic, often between 1.2%‑2.1% across top ad positions.
- Search queries with AI Overviews see organic CTR drops of ~61% YOY.
- Even outside AI Overviews, general CTR has declined, signaling broad shifts in how users interact with results.
Organic and Paid Search Performance Highlights
- Paid search ads deliver a 1.16% higher conversion rate compared to organic search, clearly demonstrating their advantage in driving immediate user action.
- 53% of all Google traffic is generated through organic search, emphasizing its critical importance for long-term visibility and reach.
- Businesses earn an average of $8 in profit for every $1 spent on Google Ads, highlighting the strong ROI potential of paid advertising campaigns.
- Moving up one position in Google search results can boost click-through rates (CTR) by 32.3%, making SEO improvements extremely impactful.
- The top organic search result receives 37.7% more clicks than the top paid ad, signaling higher user trust in organic listings.
- Over 96% of websites receive zero traffic from Google, strongly underscoring the importance of effective SEO strategies.

Rise of Zero‑Click Results in Google Searches
- Zero‑click search rates exceeded ~65% by 2025, up sharply from prior years.
- Mobile zero‑click rates outpace desktop, with mobile hitting ~77%.
- A large majority (88.1%) of queries triggering AI Overviews are informational.
- U.S. zero‑click searches grew from 24.4% in 2024 to ~27.2% in 2025.
- News‑related zero‑click searches climbed from 56% to ~69%, reducing referral traffic.
- Many sites now see most search visibility without traditional click‑throughs.
- Zero‑click behavior reshapes how content is valued and monetized on and off Google.
- Marketers increasingly optimize for featured snippets and AI overviews to capture attention.
Impact of AI Overviews on Google Search Experience
- AI Overviews are now integrated into Google Search in over 200 countries and territories, transforming how answers are delivered atop search results.
- These summaries appear for over 20.5% of keywords in Google searches, and for some query categories trigger AI Overviews in up to 60% of cases.
- AI-generated summaries have contributed to increased zero‑click search behavior, where users get answers without clicking external sites.
- Critics argue that some overviews can be misleading or harmful, especially in health queries where inaccurate guidance has been detected.
- Experiments with AI Mode, a fully AI‑generated search experience, reflect Google’s broader strategy to integrate generative results more deeply.
- Publishers and content creators report that traditional click traffic has declined, with AI Overviews dominating.
- AI Overviews aim to provide richer context with source links and summarized insight, but also raise questions about traffic impact and content attribution.
- Google continues refining the feature, balancing utility and accuracy across languages and regions.
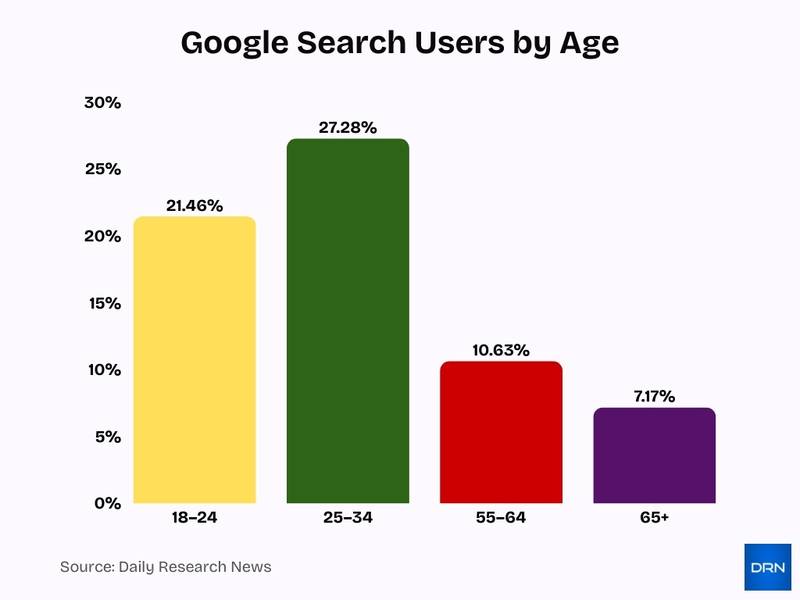
Demographic Breakdown of Google Search Users
- Young adults aged 18–24 and 25–34 comprise 21.46% and 27.28% of Google Search users globally, forming the largest share of active searchers.
- In the U.S., users aged 25–34 represent 27% of Google searches, with 25–44 dominating over half of active users.
- Users aged 55–64 account for 10.63% and 65+ for 7.17% of Google traffic, showing rising adoption among 55+ for health queries.
- Globally, 57% of Google visitors are male, creating a slight male lean, especially in tech searches across markets.
- Adults aged 25–49 represent the core voice search demographic at 65% daily usage, with the fastest growth in 35–54.
- College-educated users spend 38% more time on search results, while higher-income groups lead in transactional queries.
- Gen Z and millennials (18–34) form 63% of users, driving trend-based and entertainment searches.
- During events, search spikes occur across ages, with 55% of teens using voice daily amid news surges.
Performance of Page One and Top Three Google Rankings
- #1 organic position captures an average CTR of 27.6%.
- The top 3 rankings collectively account for 54.4% of all clicks.
- Page one results receive 91.5% or more of total clicks, with page two under 1%.
- Featured snippets cause a 46% CTR drop for the first organic position.
- Position #1 sees 39.8% CTR in some analyses without SERP features.
- Structured data-rich snippets boost CTR by 5-30%.
- Review schema stars increase CTR by 35% over plain links.
- Moving up one position boosts CTR by an average 32.3%.
- Page two clicks total just 0.63% of searches.
Usage of Image, Video, and Vertical Search on Google
- Google Lens processes 20 billion visual searches monthly, with 20% shopping-related.
- Google image search accounts for 10.1% of total Google traffic and 1 billion daily clicks.
- Eight out of ten videos in Google searches come from YouTube.
- Google Discover reaches over 800 million monthly users.
- YouTube dominates with more than 50% of ranking videos in SERPs.
- 19% of Google SERPs display images.
- Videos boost organic SERP traffic by up to 157%.
- Google Lens handles over 20 billion monthly searches.
- Visual search adoption grows 21% annually through 2025.
Google Search User Behavior Insights
- 23% of users choose Google’s autocomplete suggestions, showing how predictive search strongly influences query formulation.
- Only 0.44% of users proceed to the second page of search results, highlighting the critical importance of first-page visibility.
- Around 65% of searchers click on organic search results, reinforcing strong user trust in non-paid listings over ads.

Trends in Local and “Near Me” Searches on Google
- Searches with local intent (e.g., “near me”) drive significant mobile traffic.
- More than 97% of internet users search online to find local businesses.
- Local packs and maps increasingly dominate local queries.
- Searches for business hours and directions are among the most common local queries.
- Local voice searches continue rising along with smart assistant use.
- Mobile local search often drives conversion‑oriented outcomes (calls, visits).
- Multi‑language local search queries are increasing in markets like India and Europe.
- Local SEO remains a priority for small business visibility on Google.
Mobile Phone Voice Assistant Usage Trends in the US
- Alexa (Amazon) is used by 26% of mobile users, and while it is popular in smart home devices, its presence on mobile phones remains significantly lower.
- Siri (Apple) leads the market with 90% usage on mobile phones in the US, and it continues to be the most widely used voice assistant among smartphone users.
- Google Assistant follows closely with a strong 75% usage rate, and its deep integration across Android devices plays a key role in its widespread adoption.

Advertising Revenue Generated From Google Search
- Search advertising remains one of Alphabet’s core revenue pillars, contributing a significant portion of its total ad revenue.
- Alphabet’s search and advertising revenue grew ~12% in 2025, outpacing general digital ad market growth.
- Analysts expect total company revenue to grow to ~$454.8 billion in 2026, with search ads a major component.
- AI integration supports new ad formats tied to Overviews and AI Mode experiences.
- Marketers increasingly allocate budgets to search ads that appear alongside rich result features.
- Paid search remains valuable for transactional queries despite competition from organic verticals.
- Investment in branded search remains high because intent is captured at the moment of need.
- Search ad performance metrics continue evolving as machine learning optimizes bidding and targeting.
Future Outlook and Predictions for Google Search
- By September 2025, Google’s AI Overviews were present on 30% of U.S. desktop keywords, up 492% from just 10% six months earlier, signaling rapid AI integration into core search.
- A 2025 study found organic CTR on queries with AI Overviews dropped 61%, and paid CTR fell 68%, indicating a major shift in how search results are consumed and monetized.
- Research suggests AI search visitors could surpass traditional search visitors by 2028, accelerating the move toward generative-first search experiences.
- Zero-click searches in Europe reached 59.7% of Google queries in 2024, up from 34% in 2017, reflecting shrinking traffic from traditional “blue links.”
- By 2030, the visual search technology market is projected to reach $75 billion from $15 billion in 2025, driven by AI-powered image recognition and search interfaces.
- Global voice-enabled devices are expected to reach 8.4 billion units, with voice commerce forecast to account for 30% of total ecommerce by 2030, reinforcing voice search growth.
- The global voice commerce market is projected to grow from $42.75 billion in 2023 to $186.28 billion by 2030, a 24.6% CAGR, underscoring expanding voice-driven search transactions.
- By 2028, voice search is expected to drive around $45 billion in consumer spending, making conversational search a core channel for commercial queries.
- Surveys show more than 50% of consumers believe they will use voice search more than traditional search by 2030, aligning with shifts toward AI-driven, multimodal interfaces.
Frequently Asked Questions (FAQs)
Google held about 89.99% to ~91.65% of the global search engine market share in 2025, according to multiple tracking reports.
Google processed approximately 13.6 billion to over 9.1 billion daily search queries in 2025, depending on the measurement source.
Around 58% of Google searches resulted in zero clicks in 2025, indicating users often found answers without leaving the SERP.
AI Overviews appeared in roughly 13% to 18% of Google searches globally during 2025, based on available analysis.
Conclusion
Google Search’s landscape reflects a dynamic fusion of AI, user behavior, and evolving interfaces. From AI Overviews reshaping how answers are delivered to the persistent importance of traditional rankings, one thing remains clear: search continues to grow in response to user expectations and technological possibilities. Advertising revenue and rich result features underscore Google’s central role for businesses and consumers alike.
As voice, visual, and local search trends continue to grow, the platform’s future will hinge on striking a balance between innovation and usability for a global audience. Explore these trends and data to understand not just where Google Search stands today but where it’s heading tomorrow.