
LinkedIn has cemented its role as the premier professional advertising platform. Marketers focused on B2B audiences continue to allocate sizeable budgets to LinkedIn ads, leveraging its data-rich profiles and precision targeting to drive leads, pipeline growth, and brand authority. For example, 82% of B2B marketers report using LinkedIn ads to reach decision-makers and industry professionals, underlining the platform’s strategic value in campaigns.
Real-world brands in enterprise SaaS and professional services increasingly lean on LinkedIn advertising to generate high-quality B2B leads, while B2B tech firms use Sponsored Content and Lead Gen Forms to shorten sales cycles. As we examine the latest data, these trends highlight LinkedIn’s expanding influence in digital advertising. Let’s explore the key statistics shaping the future of LinkedIn advertising.
Editor’s Choice
- 82% of B2B marketers use LinkedIn ads for professional targeting and engagement.
- LinkedIn ad revenue is forecast to reach $8.2 billion in 2025, up about 18.3% from prior projections.
- LinkedIn ads deliver a 113% return on ad spend (ROAS) according to recent benchmarks.
- Global LinkedIn membership has surpassed 1.2 billion users across more than 200 countries.
- 32% of U.S. adults use LinkedIn, matching other major platforms in reach.
- LinkedIn’s engagement reportedly grew 44% year over year in 2024.
- Average cost per click on LinkedIn ranges roughly from $2 to $7, depending on campaign type.
Recent Developments
- LinkedIn recorded roughly 10% year-over-year growth in advertising activity entering 2025.
- Ad products continue to expand with a stronger emphasis on personalization and professional relevance.
- Campaign Manager updates introduced more granular audience targeting controls.
- AI-driven delivery and optimization tools now play a larger role in ad performance.
- Platform-level measurement updates improved trust in impression and billing accuracy.
- New ad formats continue to roll out to support varied B2B objectives.
- Reporting interfaces now provide deeper insights into engagement and conversion paths.
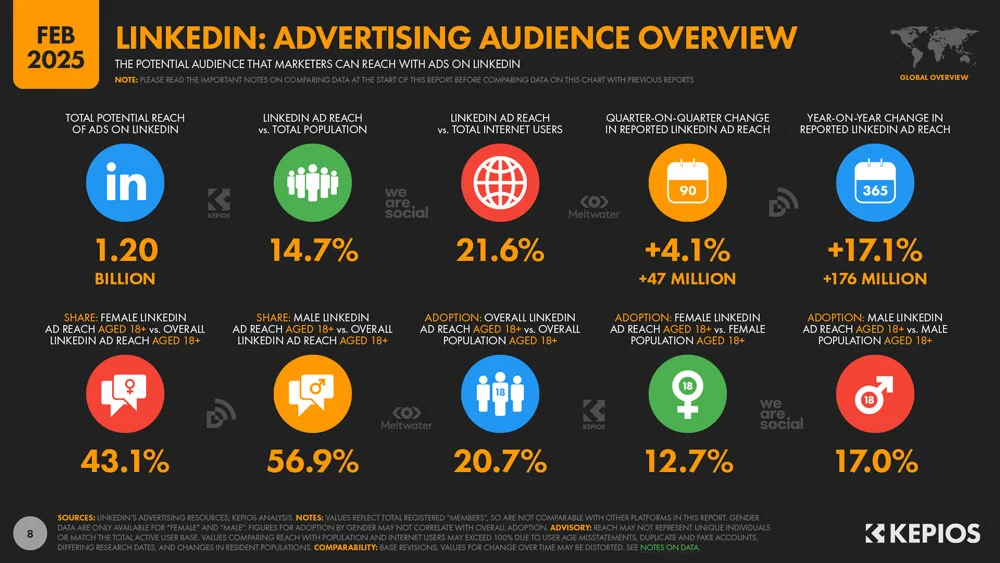
LinkedIn Advertising Audience Overview – February 2025
- LinkedIn’s total potential advertising reach stands at 1.20 billion users worldwide, highlighting the platform’s massive scale for marketers.
- 14.7% of the global population can be reached through LinkedIn ads, underscoring its strong penetration among professionals.
- LinkedIn ads reach 21.6% of total internet users, making it one of the most effective platforms for targeting online audiences.
- Quarter-on-quarter growth in LinkedIn’s reported ad reach increased by +4.1%, adding approximately 47 million new reachable users in just three months.
- Year-on-year growth shows an even stronger expansion of +17.1%, equivalent to 176 million additional users compared with last year.
- The gender split of LinkedIn’s ad audience (18+) is weighted toward men:
- 56.9% male
- 43.1% female
- Overall adoption among adults aged 18+ shows that 20.7% of the global adult population can be reached via LinkedIn advertising.
- Among women aged 18+, LinkedIn ad reach accounts for 12.7% of the total female population.
- Among men aged 18+, LinkedIn ad reach is higher at 17.0%, reinforcing the platform’s stronger penetration among male professionals.
Revenue Statistics from LinkedIn Advertising
- LinkedIn generated approximately $16.2–$16.4 billion in total revenue in 2024, with advertising as a major driver.
- Advertising revenue grew about 12.7% year over year.
- Ad revenue alone is projected to reach $8.2 billion in 2025.
- LinkedIn’s advertising growth continues to outpace many traditional digital media channels.
- Professional targeting commands higher CPM and CPC compared to mass-market platforms.
- About 58% of marketers rate LinkedIn as delivering the best return on ad spend.
- Premium placements and advanced formats contribute disproportionately to revenue growth.
- Sponsored Content accounts for a major share of total LinkedIn ad spend.

LinkedIn Advertising Audience Distribution by Age and Gender
- Ages 18–24 constitute a notable segment of the LinkedIn advertising audience, accounting for 16.2% male users and 12.5% female users.
- Ages 25–34 form the largest demographic group within the ad audience, comprising 26.8% male users and 20.5% female users.
- Ages 35–54 represent a moderate proportion of the LinkedIn ad audience, with 11.7% male representation and 9.0% female representation.
- The 55+ age group holds the smallest share of the advertising audience, consisting of 2.2% male users and only 1.1% female users.

Ad Formats and Usage Trends on LinkedIn
- Sponsored Content delivers average click‑through rates around 0.45–0.65%, far higher than LinkedIn Text Ads at 0.02–0.08%, making it the dominant performance format.
- LinkedIn’s own ads guide highlights Sponsored Content, video, carousel, Lead Gen Forms, and messaging as the core ad formats, indicating they sit at the center of most campaign setups.
- Around 2 in 3 B2B marketers using LinkedIn say video is their most popular content type, underscoring the rapid adoption of video ads for storytelling.
- LinkedIn video ads typically generate 20–30% view rates and can boost conversion rates by nearly 30% compared with non‑video formats.
- LinkedIn reports average Lead Gen Form conversion rates of about 13%, versus roughly 4% on landing pages, showing in‑feed forms convert at over 3× the rate of external pages.
- Benchmark data places Sponsored Content CTR at 0.45–0.65% versus 0.02–0.08% for Text Ads, illustrating how lower‑cost text and dynamic units mainly support cheap reach and awareness.
- Sponsored Message and Conversation Ads show 3–5% open rates and 15–30% engagement after open, reflecting strong response for segmented, direct outreach.
- Lead Gen Forms often deliver 40–60% higher conversion rates than traditional landing pages, strengthening their role in demand‑generation‑focused LinkedIn campaigns.
- Typical LinkedIn Lead Gen Form campaigns see 10–15% click‑to‑lead rates with mobile conversions in the 12–18% range, supporting both brand and pipeline goals.
- The official LinkedIn Ads Guide emphasizes evolving creative specs across video, carousel, and messaging, positioning these formats for continuous A/B testing and performance optimization.
Sponsored Content Performance on LinkedIn
- Sponsored Content averages a CTR between 0.44% and 0.65% across industries.
- Benchmarks show about 0.5% CTR as a typical performance baseline.
- Sponsored posts outperform organic posts by roughly 28% in engagement.
- LinkedIn ads drive 80% of all B2B social media leads, largely through Sponsored Content.
- Feed placement improves impression quality for targeted professional audiences.
- Sponsored video view rates typically range from 0.25% to 0.35%.
- Strong creative relevance can push engagement above 1%.
- Placement and targeting refinements continue to lift Sponsored Content efficiency.
Video and Carousel Ads Insights on LinkedIn
- LinkedIn video ads deliver an average view-through rate of ~29.5%, indicating that nearly 1 in 3 impressions result in a counted view.
- Sponsored video content on LinkedIn sees an average CTR of ~0.44%, slightly above carousel’s ~0.40% but below top single-image placements.
- Video posts reach an average engagement rate of ~5.6%, outperforming single-image posts at ~4.85% in the LinkedIn feed.
- Video ad view rates commonly fall in the 20–30% range, with strong creatives pushing view rates above 40% for some campaigns.
- Short LinkedIn videos under 30 seconds can drive 35–45% completion rates, while videos over 60 seconds often drop below 20% completion.
- Video Sponsored Content can reach around 1.6% engagement, over 3x higher than non-video sponsored content at about 0.5%.
- Overall, Sponsored Content CTR on LinkedIn typically ranges between 0.44% and 0.65%, with video ads at ~0.44% aligning closely with these benchmarks.
- Carousel Sponsored Content averages around 0.40% CTR, slightly below single-image ads at 0.61% but still delivering strong interactive engagement.
- LinkedIn video campaigns report engagement rates of about 1.8% alongside view-through rates near 29.5%, supporting their role in upper-funnel storytelling.
Lead Gen Forms Metrics on LinkedIn
- Lead Gen Forms average around 10% completion rates across campaigns.
- Some advertisers report conversion rates as high as 13%.
- Native forms outperform external landing pages, which average about 2.35% conversion.
- Cost per lead is often lower when using LinkedIn Lead Gen Forms.
- Performance improves when forms are paired with high-value content offers.
- Autofilled profile data reduces friction and boosts submission rates.
- Lead quality from native forms is often higher than off-platform leads.
- Integrated analytics help advertisers optimize form performance.
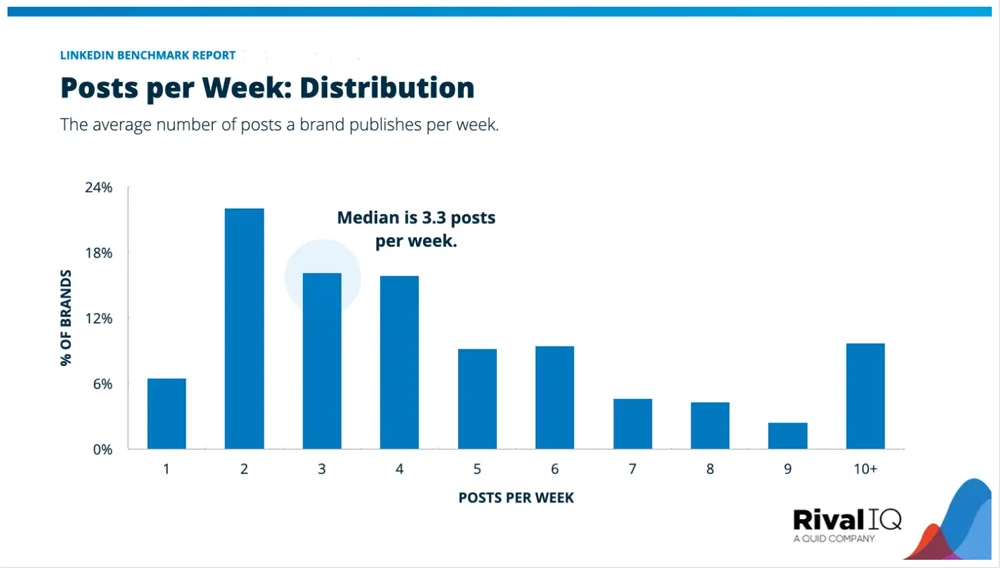
LinkedIn Brand Content Publishing Frequency
- The median posting rate on LinkedIn stands at 3.3 posts per week for brands.
- The largest proportion of brands (approximately 22%) typically publish 2 posts per week.
- Roughly 16% of brands share content 3 times per week, with a comparable percentage posting 4 times weekly.
- Close to 9% of brands publish content 5 times per week, while a similar 9% also post 6 times per week.
- Only 6% of brands maintain a once-per-week posting schedule on LinkedIn.
- Fewer than 5% of brands post between 7–9 times per week, indicating a decline in frequency at higher posting levels.
- Notably, over 10% of brands publish 10 or more posts per week, highlighting a high-volume content strategy.
Ad Engagement Rates Across LinkedIn
- Overall, LinkedIn ad engagement rates typically range from 0.7%–1.5%, with feed CTRs averaging around 0.44%–0.65%.
- Sponsored Message/InMail campaigns often see 40%–60% open rates and roughly 18%–25% response rates.
- LinkedIn Sponsored Content engagement (around 0.5%–1.6%) generally outperforms many standard display ad CTR benchmarks below 0.5% on other platforms.
- By industry, LinkedIn engagement can vary from about 3.3% in Healthcare & Life Sciences to roughly 3.9% in Retail & Consumer Goods for top-performing pages.
- Video and carousel formats can lift LinkedIn Sponsored Content engagement to around 1.6%, often higher than static single-image ads, near 0.5%–0.6%.
- Campaigns using highly relevant, audience-tailored creative often see engagement rates 2x or more above the platform average,s around 0.7%–1%.
- Narrow, well-defined B2B audiences on LinkedIn can push CTRs above 1%, versus broader targeting that frequently stays near 0.4%–0.6%.
- Optimizing ad frequency and posting time can move engagement from roughly 0.4% at suboptimal times toward 1%+ during peak workday hours.
Click-Through Rate Benchmarks for LinkedIn Ads
- Average LinkedIn Ads CTR benchmarks typically range between 0.44%–0.65%, with anything above 1% considered strong performance.
- Median Sponsored Content CTR commonly centers around 0.5%–0.52% across many B2B industries on LinkedIn.
- Single-image ads in Sponsored Content often reach around 0.61% CTR, outperforming carousel ads at roughly 0.40% CTR.
- Sponsored Message/Conversation Ads frequently deliver 2%–5% CTR, with top flows hitting 8%–10% CTR, far above feed ad norms.
- Broad feed-based Sponsored Content typically sees CTR around 0.44%–0.65%, while poorly targeted campaigns can drop below 0.3% CTR.
- Sponsored Messaging CTR around 3.2%–3.6% is common, compared with roughly 0.44% for Sponsored Content and about 0.02% for Text Ads.
- LinkedIn feed ad CTR of roughly 0.3%–0.5% usually outperforms standard web display campaigns, which often hover near or below 0.1%–0.2% CTR.
- Adding larger creatives can boost CTR by up to 38% versus smaller visuals, especially for Sponsored Content with strong imagery.
- Clear, direct CTAs and headlines tailored to a defined audience can lift LinkedIn CTR from ~0.4% toward or above 1%, especially in optimized B2B campaigns.
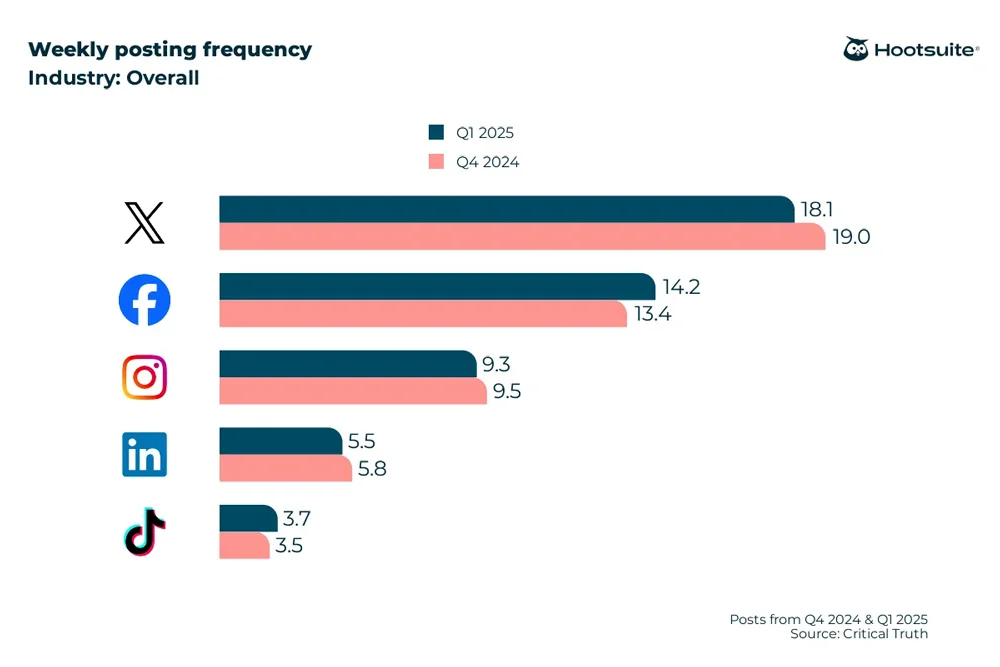
Platform-wise Weekly Posting Activity Trends
- X experienced a minor decline, posting 18.1 times per week in Q1 2025, down from 19.0 in Q4 2024.
- Facebook showed increased activity, averaging 14.2 posts per week in Q1 2025, rising from 13.4 previously.
- Instagram recorded a slight decrease, with 9.3 posts per week in Q1 2025, compared to 9.5 posts per week earlier.
- LinkedIn maintained a slightly lower posting rate, publishing 5.5 times per week in Q1 2025, down from 5.8 in Q4 2024.
- TikTok saw a modest increase, reaching 3.7 posts per week in Q1 2025, up from 3.5.
Cost Per Click and CPM Trends on LinkedIn
- Average cost per click typically ranges from $3.94 to $5.58.
- Competitive campaigns may see CPCs between $5 and $10.
- LinkedIn CPC remains higher than many other platforms due to audience value.
- CPM benchmarks often range from $30 to $100 plus.
- Sponsored Content CPMs commonly fall between $33 and $150 plus.
- Video CPMs often land toward the lower end of the range.
- Average CPCs increased roughly 8% year over year in competitive sectors.
- Narrow professional targeting drives higher bid requirements.
- High-value decision-maker audiences often exceed average CPC benchmarks.
ROI and Revenue Impact of LinkedIn Ads
- LinkedIn ads deliver an average 113% ROAS in 2025 benchmarks.
- LinkedIn accounts for roughly 39% of B2B ad budgets, up from prior years.
- About 35% of new business deals show influence from LinkedIn advertising.
- Many advertisers report 2 to 3 times higher conversion rates versus other platforms.
- Sponsored InMail achieves open rates between 50% and 60%.
- Higher lead quality supports stronger long-term customer value.
- ROI is strongest when campaigns align with account-based marketing strategies.
- Advertisers often reinvest returns into nurturing and retargeting programs.
Industry and Sector Performance on LinkedIn
- SaaS and healthcare brands on LinkedIn often pay >$7 CPC, with SaaS/tech averaging $6.45 and healthcare $6.85 per click.
- Finance and education sectors typically see $3–$5 CPC, with finance around $2.6–$7.3 and education roughly $3.1–$4.8 on LinkedIn.
- FinTech LinkedIn campaigns usually record CPLs between $60 and $150+, with enterprise setups frequently exceeding $200 per lead.
- Professional services on LinkedIn average roughly $5.9 CPC and $80–$120 CPL, supporting strong ROI in B2B funnels.
- Technology/SaaS categories see top performance with ~0.7% CTR, $6.45 CPC, and conversion rates near 5.9% on LinkedIn.
- Legal, finance, and regulated industries often accept >$7 CPC and $90–$150+ CPL due to higher-intent, deal-rich leads.
- HR tech campaigns report $4–$7 CPC and $90–$140 CPL, trading higher costs for stronger lead quality on LinkedIn.
- Retail and consumer advertisers contribute only about 2% of LinkedIn ad revenue, reflecting relatively weaker sector performance.
- Business, industrial, and technology sectors dominate LinkedIn ad spend, driving the majority of the platform’s projected $8.2 billion 2025 revenue.
Regional Benchmarks for LinkedIn Advertising
- In North America, average LinkedIn CPC often ranges from $8 to $15, with CPM frequently above $40 for B2B decision-maker targeting, putting it at the upper end of global ranges.
- Across Latin America, the average LinkedIn CPL is around $60, typically less than half of North America’s ~$230 CPL for similar campaigns.
- European (EMEA) LinkedIn campaigns see midrange costs, with average CPC around £2–£3 and CPL near $120, positioning them between APAC and North America benchmarks.
- In APAC, LinkedIn CPC can be as low as £0.31 in some markets while the average regional CPL is about $80, illustrating highly variable performance across countries.
- Regions with higher professional density, like North America and Western Europe, often reach only 3–5% of their total addressable audience with LinkedIn impressions per month at typical budgets, inflating impression costs.
- U.S.-focused LinkedIn campaigns commonly report conversion rates above 30% on well-optimized lead gen forms versus low-single-digit sitewide conversion rates in many other regions.
- Markets with heavy B2B advertiser saturation, such as U.S. SaaS and tech hubs, can push LinkedIn CPC above $15 in Q3 as bidding intensity peaks.
- Advertisers localizing LinkedIn creatives by region often see 10–20% higher CTR and up to 15% lower CPM, improving both relevance and cost efficiency.

Targeting and Audience Segmentation in LinkedIn Ads
- LinkedIn’s audience attributes let brands reach over 1.2 billion professionals by job title, industry, company size, and seniority, driving B2B conversion rates between 5–15% on well‑targeted campaigns.
- Targeting senior decision-makers often yields CPCs 30–60% higher than broader professional audiences because C‑suite inventory is more competitive yet delivers higher deal values.
- Advertisers focusing spend on priority regions report up to 20–30% lower CPCs and significantly better ROAS when geographic targeting aligns with sales coverage and buying power.
- Segmented LinkedIn campaigns commonly achieve conversion rates in the upper end of the 5–15% benchmark range, while broad targeting tends to sit near the lower bound or below.
- Precision targeting that narrows audiences by role, industry, and seniority can cut wasted impressions by 20–40%, improving effective CPM and lead quality.
- Combining demographic filters (age, location) with firmographic data (industry, company size, seniority) has been shown to lift LinkedIn ad relevance and engagement by 15–35%.
- Lookalike audiences built from high‑value customer lists can expand reach by 3–10x while maintaining conversion rates close to or slightly below seed audiences.
- Device-level segmentation on LinkedIn often reveals mobile users delivering 10–25% higher click‑through rates, while desktop traffic typically shows stronger post‑click conversion rates for complex B2B offers.
Retargeting and Funnel Stats on LinkedIn
- LinkedIn retargeting campaigns often see CTRs around 0.7–1.0%, compared with average LinkedIn ad CTRs of about 0.44–0.65% for broad cold audiences.
- Warm retargeted audiences on LinkedIn typically convert 3–5X higher than cold traffic, dramatically improving funnel performance.
- Sequential retargeting sequences in B2B LinkedIn campaigns have driven conversion lifts of 200%+ versus one-off cold ads by nurturing users through longer funnels.
- Only about 2% of website visitors convert on their first visit, while retargeted visitors are roughly 3X more likely to return and take action, boosting LinkedIn lead quality from high-intent site traffic.
- LinkedIn Matched Audiences (including website and email-based retargeting) have delivered around a 30% increase in CTR and a 14% reduction in post-click cost-per-conversion in pilot campaigns.
- For many B2B advertisers, LinkedIn’s CPL benchmarks around $60–120, but retargeting warm audiences can reduce effective CPL by roughly 28% compared with broader paid search in similar segments.
- Retargeting warm traffic on LinkedIn can work with budgets as low as $500–1,000/month, often generating results within 30–60 days due to higher engagement efficiency.
- By capping impression frequency and rotating creatives, B2B LinkedIn advertisers maintain CTRs 20–30% higher on retargeting layers than on over-exposed cold audiences, helping prevent ad fatigue.
- LinkedIn drives about 80% of B2B leads generated from social media, making funnel-based retargeting and account-focused sequences especially powerful for ABM programs on the platform.
Frequently Asked Questions (FAQs)
About 82% of B2B marketers use LinkedIn Ads to reach business decision-makers and professionals.
LinkedIn Ads can reach approximately 14.6% of adults worldwide.
The average CPC for LinkedIn Ads across industries is about $5.58 per click.
LinkedIn reported approximately $2 billion in ad revenue in one quarter in 2025.
Conclusion
Continues to shape up as a pivotal year for LinkedIn advertising, where costs remain premium, but outcomes justify investment for B2B advertisers. Across CPC, CPM, engagement, and conversion benchmarks, LinkedIn consistently delivers high-value leads and measurable ROI. Performance varies by industry and region, making targeting, segmentation, and funnel design critical to success.
With the right strategy, LinkedIn advertising remains one of the most reliable channels for driving professional reach, pipeline growth, and long-term revenue impact.


