
The Tor network remains one of the most widely used tools for online anonymity and privacy. Its impact is visible both in countries facing censorship, where it allows free access to information, and in journalism, where it helps whistleblowers share sensitive documents securely. In this article, we examine recent data on Tor’s network size, user base, and growth trends to show how far the network has come. Read on to explore the full picture.
Editor’s Choice
- As of July 2025, Tor supports roughly 8,000 active relays across the globe.
- Up to 2.5 million global users reportedly use Tor regularly.
- The network offers more than 65,000 unique .onion addresses.
- Around 6–7% of Tor users access .onion hidden services daily.
- In 2024, the project behind Tor introduced major upgrades, for example, a toolkit (OnionSpray) to ease the conversion of websites into .onion domains.
- The network supports a mix of relay types, guard, middle, and exit relays, to route traffic and preserve user anonymity.
- Tor continues to evolve; in 2024–2025, enhancements to performance, security, and censorship circumvention were rolled out.
Recent Developments
- Tor Project launched OnionSpray in 2024, simplifying .onion site conversions for existing websites.
- Arti 1.6.0 release in 2025 added circuit padding and defenses against DropMark attacks for enhanced privacy.
- WebTunnel bridges grew from 60 to 143 by late 2024, blending Tor traffic with web protocols.
- Tor urgently sought 200 additional WebTunnel bridges by the end of 2024 to counter Russian censorship.
- Global Tor users reached 2.5 million with regular usage, per 2025 reports.
- The Tor network operated 8,000 active relays and 2,000 bridges as of July 2025.
- Over 150,000 onion services served traffic at nearly 4 Gbps collectively.
- Arti 1.8.0 in late 2025 improved onion services and relay development via Rust rewrite.
Relay Network Scale
- The overall relay expansion has slowed, shifting emphasis toward capacity improvements rather than increasing the sheer relay count.
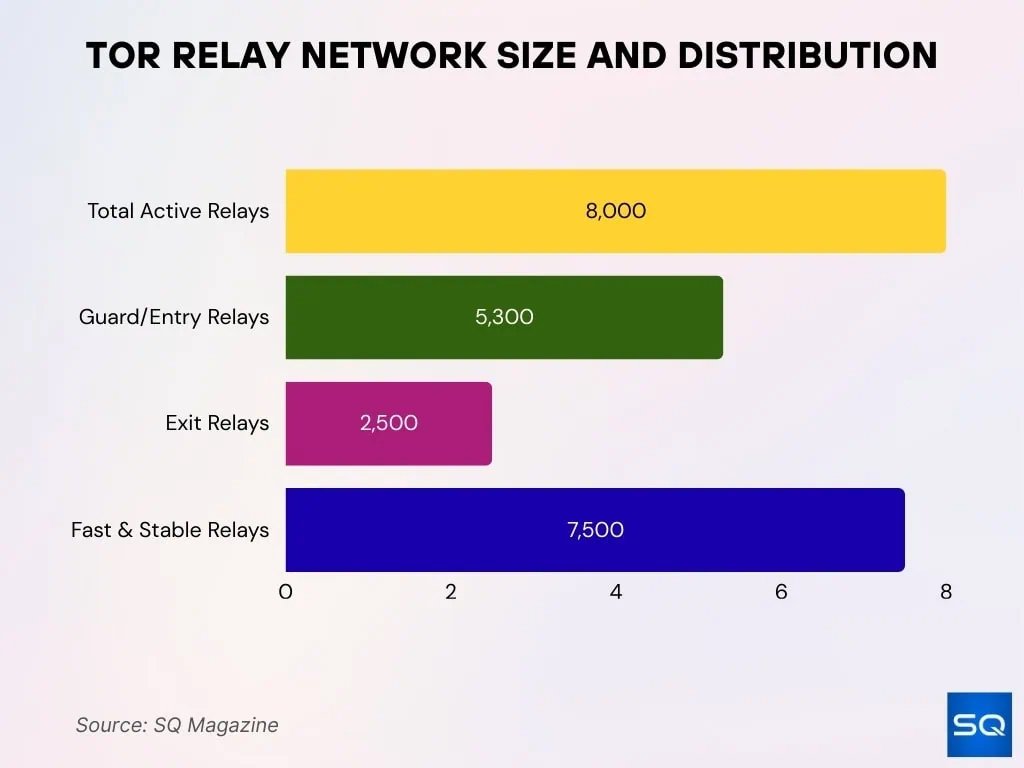
- As of July 2025, the Tor network operates around 8,000 active relays, maintaining a broad and resilient infrastructure.
- Of these relays, approximately 5,300 function as guard/entry relays and 2,500 serve as exit relays, supporting secure traffic flow.
- Over 7,500 relays are flagged as “fast and stable,” indicating strong performance across the network.
- Historical studies show that in 2022, Tor maintained roughly 6,559 relays, reflecting steady expansion over time.
- Relay bandwidth has experienced significant growth, with intervals showing 50–70% increases, demonstrating enhanced network capacity.
- Relays are now distributed across fewer Autonomous Systems (ASes) than before, reducing overall network diversity.
- Relay operators often plateau in participation, as many new relays emerge but retire quickly due to cost or maintenance demands.
Daily Active Users Over Time
- In 2023, Tor averaged more than 4.61 million daily users, a high point in recent reporting.
- More recent 2025 estimates place regular users at about 2.5 million, reflecting measurement variations.
- Some sources report surges of more than 3 million daily users in early 2025.
- Variation in user counts often reflects different definitions, such as relay connections vs bridge usage.
- Tor metrics estimate users by analyzing requests to relays and bridges, not via registration.
- Peaks often correlate with censorship spikes or geopolitical turmoil, prompting users to seek anonymity.
- Despite fluctuations, long-term usage consistently remains in the multi-million range.

Tor Browser Download Statistics
- Tor Browser exceeded 200 million downloads cumulatively by mid-2024.
- Daily Tor Browser downloads averaged around 100,000 in earlier periods.
- Tor Browser received up to 2 million update pings daily as of 2017.
- 1.95 million daily Tor users connected directly on October 26, 2024.
- Peak daily Tor usage hit over 9 million users on October 21, 2023.
- Tor Browser for Android supports devices running Android 5.0 or later.
- Update requests spiked to 750,000–1,000,000 during new version releases.
- Windows dominates Tor Browser download platforms globally.
- 90% of Tor client traffic stems from Tor Browser usage.
Onion Services (.onion) Usage Statistics
- Over 65,000 unique .onion addresses exist on the Tor network.
- 54,602 onion addresses were collected in a recent study, with 38% advertised only once.
- 42.74% of onion addresses were advertised 2–5 times, and 16.45% more than 5 times.
- 6.7% of Tor users (135,000 daily) connect to .onion services for malicious purposes.
- 67% of onion addresses are classified as predominantly active, 26% mostly inactive.
- Over 2.5 million daily Tor users, with 6–7% accessing onion services.
- 50% of addresses are listed solely on public websites, 6% only on the dark web.
- 99.75% of onion services use the HTTP protocol, 4.95% use SSH.
- The dark web represents only 3% of the total Tor traffic.
Global Usage by Nation
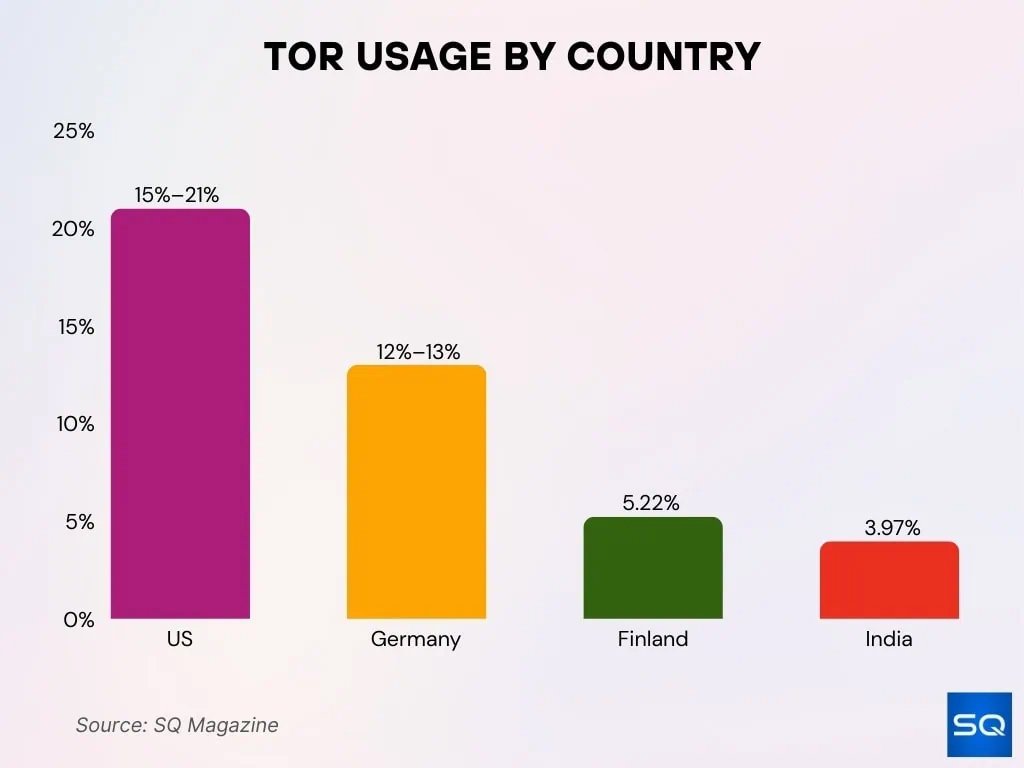
- The U.S. consistently represents a substantial portion, typically between 15% and 21% of global users.
- Germany’s contribution is regularly reported within the 12–13% range.
- Finland frequently ranks highly, registering about 5.22% of daily users.
- India is noted in some analyses as accounting for approximately 3.97% of daily users.
- Russia is repeatedly identified as a leader in the mean daily Tor user count.
- France, the Netherlands, the UK, Indonesia, and Iran maintain consistent representation in top-tier usage lists.
- In combination, the U.S. and Germany are sometimes found to make up over 68% of global Tor traffic.
- National censorship measures can curtail local participation, causing official figures to undercount usage in repressive states.
Number of Active Onion Services
- Over 150,000 onion services actively serve traffic at nearly 4 Gbps across the Tor network.
- Approximately 30,000 hidden services are announced daily to directories, using 5 TB of data.
- Onion domains surged 20x over five years to exceed 700,000 unique domains by early 2022.
- Tor Metrics tracks 65,000+ .onion addresses, likely undercounting due to defunct entries.
- Crawling efforts identified 482,614 unique v3 onion addresses in the largest known dataset.
- Ahmia indexes 18,000–22,000 onion addresses weekly, many inactive.
- 50% of services last only 10 days, with 80% under a month due to short lifespans.
- Version 3 services show extrapolated unique addresses daily via HSDir relays at Tor Metrics.
Tor Usage for Surface Web vs Dark Web
- 93.3% of Tor users access surface web content rather than onion sites daily.
- Only 6.7% of Tor network users connect to onion or hidden services on average.
- 85% of daily Tor users browse regular websites, not .onion domains.
- Tor hidden service traffic constitutes just 1.5% of total Tor network bandwidth.
- 93% of Tor traffic exits to non-onion destinations like mainstream sites.
- Daily Tor users number 2-3 million, mostly for surface web privacy.
- In censored regions, Tor usage surges 50-70x via bridges for blocked platforms.
- The US leads with 17.6-21% of global Tor users accessing surface content.
Tor Usage for Illicit vs Legitimate Purposes
- 6.7% of Tor users connect daily to onion services for illicit purposes.
- Roughly 135,000 of 2 million daily Tor users (1 in 20) visit dark web pages.
- 93.3% of Tor traffic goes to Clear Web for legitimate browsing.
- In free countries, 7.8% of Tor users access potentially illicit onion services.
- Not free regimes show only 4.8% Tor users on illicit hidden services.
- Over 2 million daily Tor users worldwide prioritize privacy and circumvention.
- Dark web traffic comprises just 3% of total Tor network activity.
- Average daily Tor clients reached 2.23 million in 2019, mostly non-illicit.
Exit Node Distribution by Country
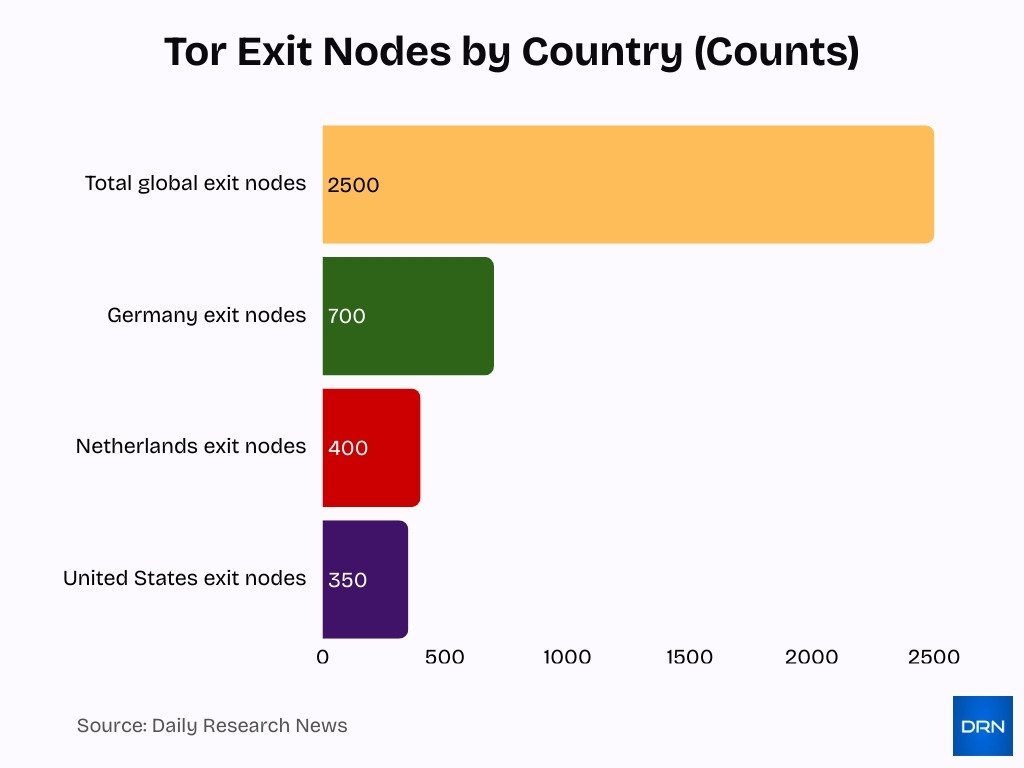
- Germany hosts the highest number of 700 Tor exit nodes, leading globally as of 2024.
- The Netherlands ranks second with approximately 400 exit nodes worldwide.
- The United States operates around 350 exit nodes, placing third in distribution.
- 2,500 total exit nodes function globally as of mid-2025.[query]
- Only 3-4 countries (the US, Germany, the Netherlands, and France) host 100+ exit relays each.
- Germany and the Netherlands lead Europe in exit node count, enhancing regional capacity.
- 79% of all Tor nodes reside in 14 Eyes surveillance alliance countries.
- The top countries provide over 68% of the global Tor traffic share via concentrated exits.
- The US holds 16% of the total Tor nodes, followed by France at 8%.
Bandwidth and Capacity Statistics
- The Tor network runs around 8,000 active relays as of July 2025.
- Relay bandwidth saw periods of 50–70% increases over time.
- Current measurement systems underestimate relay capacity by 50%.
- 10% of Tor consensus weight equates to 90-95 Gbps sustained bandwidth in 2025.
- Network capacity increased by about 200 Gbit/s (50%) after speed tests boosted relay reports.
- Bandwidth estimates underestimate total network capacity by at least 50%, more for high-bandwidth relays.
- FlashFlow improves load balancing accuracy with an 86% median error drop.
- TorMult attack with 10 servers and 109 relays at 100MB/s each can control half of the network traffic.
- Guard relay capacity grew by 91.2 Gbit/s (40.1%) in the studied periods.
Tor.com Website Traffic Breakdown
- Direct traffic takes the lead with 43.50%, indicating that a majority of visitors access Tor.com by navigating directly to the site.
- Organic search provides 37.18% of visits, demonstrating the site’s strong presence and discoverability in search engines.
- Social traffic represents 9.79%, revealing notable user interaction and engagement via social platforms.
- Referral traffic contributes 8.54%, emphasizing the influence of external websites in driving visitors.
- Display ads generate 0.56% of the traffic, whereas email sources add only 0.11%, showing minimal impact from these channels.
- Paid search remains at 0.00%, signifying no dependency on paid search advertising.

Performance and Latency Statistics
- Latency remains a barrier for applications requiring real-time communication.
- Under load, median download times may rise by 47%.
- Experimental routing methods can reduce latency to 40 ms under lab conditions.
- Congestion-aware routing may increase throughput by 42%, though with some latency trade-offs.
- These routing improvements are experimental and not widely deployed.
- Many relays and clients still use default routing focused on stability and anonymity.
- User experience varies by geography, relay hardware, and path.
- Performance constraints limit adoption for interactive or media-rich hidden services.
Bridge Usage and Censorship Circumvention
- Russia leads with 64,527 mean daily Tor bridge users, comprising 46.28% of the global total.
- The United States follows with 14,122 daily bridge users at 10.13% share.
- Iran records 9,383 mean daily bridge connections, or 6.73% worldwide.
- As of 2025, approximately 2,000 Tor bridges operate steadily, aiding censorship bypass.
- Germany contributes 7,193 daily bridge users, equating to 5.16% of the total.
- Turkmenistan sees 4,237 average daily Tor bridge clients, or 3.04% globally.
- The Tor network sustains around 2,000 bridges amid fluctuating censorship demands.
- The Netherlands has 3500 mean daily bridge users, holding 2.5 of% total.

Tor Usage in Censored Countries
- Iran saw a 950% surge in Tor bridge usage compared to early June during censorship events.
- China experienced a 70x increase in bridge users (over 10,000) in 2009 blocks.
- Russia leads with a high mean daily Tor users at 247,370 (2.66% global share).
- Countries with high political repression show 212 more bridge users per 100,000 internet users.
- Lithuania recorded 82 upturns and 56 downturns, indicating frequent censorship in 2021.
- Tajikistan and Sudan each had 6 downturns in Tor usage signaling censorship events.
- Senegal ranks in the top 10 with 203,214 mean daily users (2.19% global).
- Moldova boasts 963 Tor users per 100,000 internet users due to local restrictions.
Frequently Asked Questions (FAQs)
As of mid-2025, the Tor network operates about 8,000 active relays worldwide.
The Tor network is accessed by around 2.5 million daily users globally in 2025.
There are over 65,000 unique .onion addresses active in the Tor network by 2025.
In 2025, the Tor network includes about 2,000 bridges to help users connect in regions where public relays may be blocked.
Conclusion
Over the past decade, Tor has scaled significantly, with roughly 8,000 active relays, thousands tagged fast and stable, expanded exit node capacity, and a volunteer-driven global backbone capable of supporting millions of users. Relay and bridge growth, increased bandwidth capacity, and ongoing research into latency and routing optimization reflect a network adapting to higher demand and a shifting international climate of censorship and surveillance. Structural challenges remain, including uneven relay distribution, performance variability, and risks from relay concentration or malicious nodes.
Still, for users in censored or high-surveillance environments, Tor continues to offer a rare combination of privacy, resilience, and open access to information. As the network evolves through 2025 and the years ahead, its role as a tool for anonymity and free expression remains vital.


